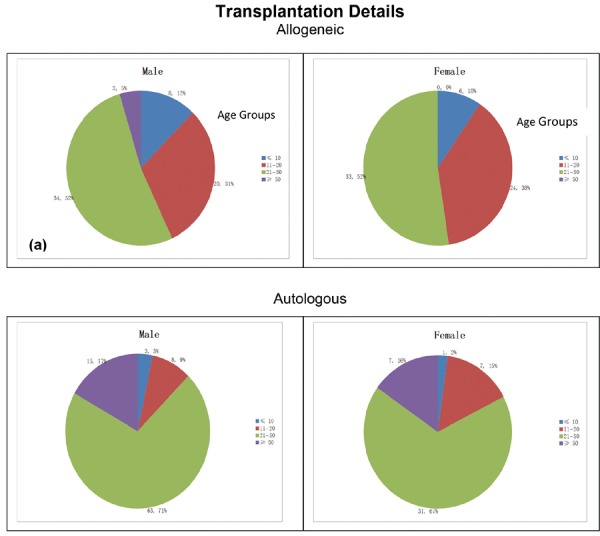
Chart 1:

Distribution of Allogeneic and Autologous donors among the various age groups. Chart 1a and 1b shows the distribution of Allogeneic donors among Male and Female subjects respectively. Chart 1c and 1d shows the distribution of Autologous donors among Male and Female subjects resp.
