Figure 3.

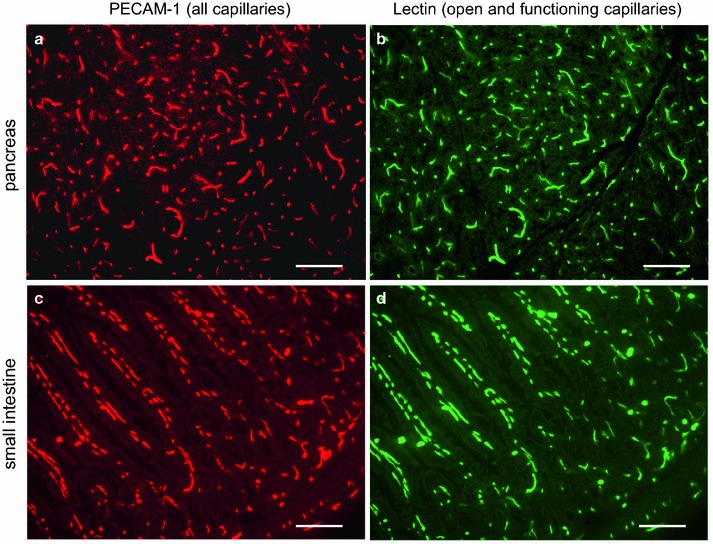
Micrographs of the pancreas and small intestine. Panels a and c show staining for PECAM-1. Panels b and d show staining for FITC-lectin. Most capillaries are FITC-lectin positive indicating blood flow. Bars 100 µm.

Micrographs of the pancreas and small intestine. Panels a and c show staining for PECAM-1. Panels b and d show staining for FITC-lectin. Most capillaries are FITC-lectin positive indicating blood flow. Bars 100 µm.