. 2015 Jun 10;4:e06990. doi: 10.7554/eLife.06990

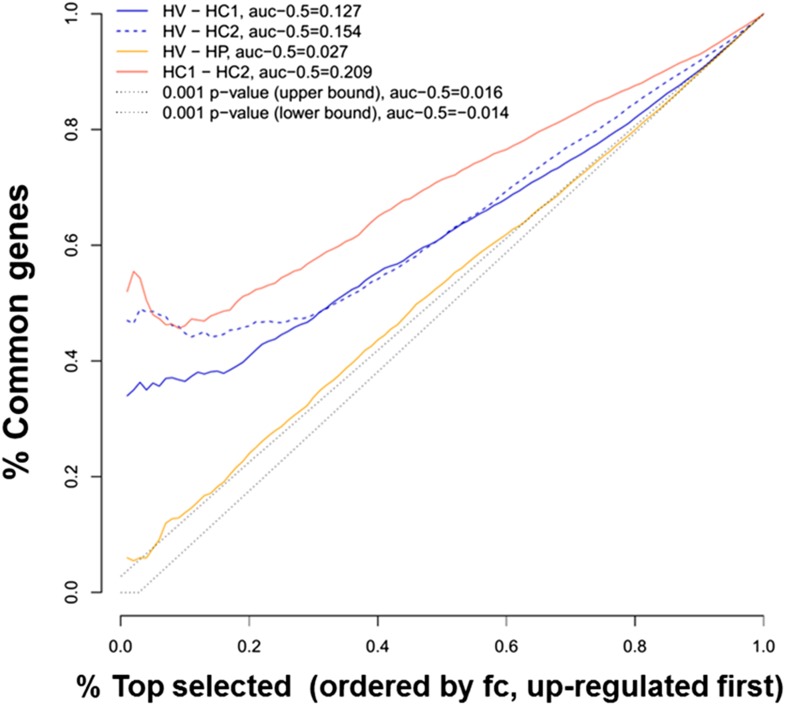
Figure 1. Ranking similarity between gene expression of human islets after cytokine exposure (HC1 and HC2) or after virus exposure (HV).

The similarity between HC1 and HC2 and between HV and palmitate exposure (HP) is also presented. The area under the curve (subtracted by a null threshold of 0.5) is indicated, as well as similarity curves corresponding to a p-value of 0.001. The figure represents the ranking similarity ordered by up-regulation. (For a detailed explanation of the calculations done, see ‘Materials and methods’, ‘gene expression ranking similarity’).

DOI: http://dx.doi.org/10.7554/eLife.06990.003

Figure 1.

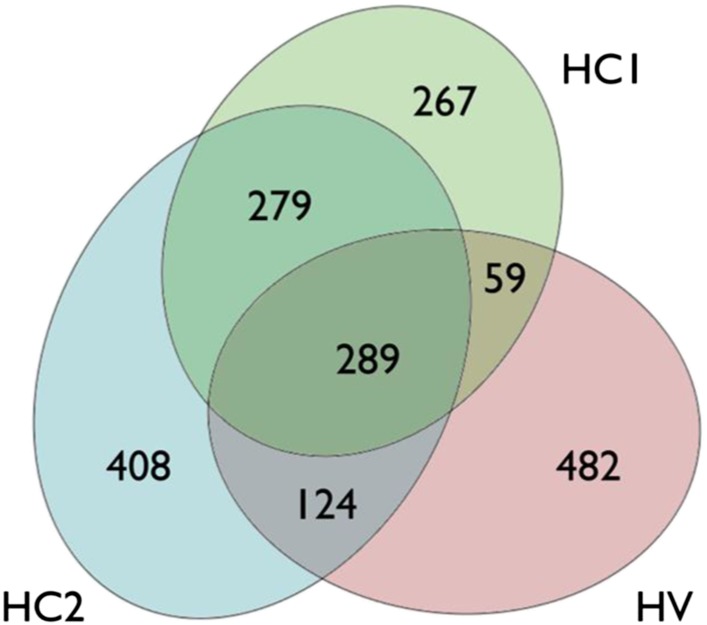
Figure 1—figure supplement 1. Venn diagram of the up-regulated genes in human islets exposed to cytokines (HC1 and HC2) or infected with CVB5 (HV).

Figure 1—figure supplement 1.

In each data set, a group of up-regulated genes was identified. The criterion for differential expression was p-value < 0.05 (paired t-test; BH-adjusted in the HC1 case). Up-regulation was identified through mean fold change. 894 genes were identified to be up-regulated in HC1, 1100 in HC2, and 954 in HV. The number of genes in each separated area is indicated. The intersection between HC1 and HV has a p-value of 2.46e-151, between HC2 and HV 2.78e-180, and between HC1 and HC2 approximately e-897 (hypergeometric distribution, 9504 genes in total).
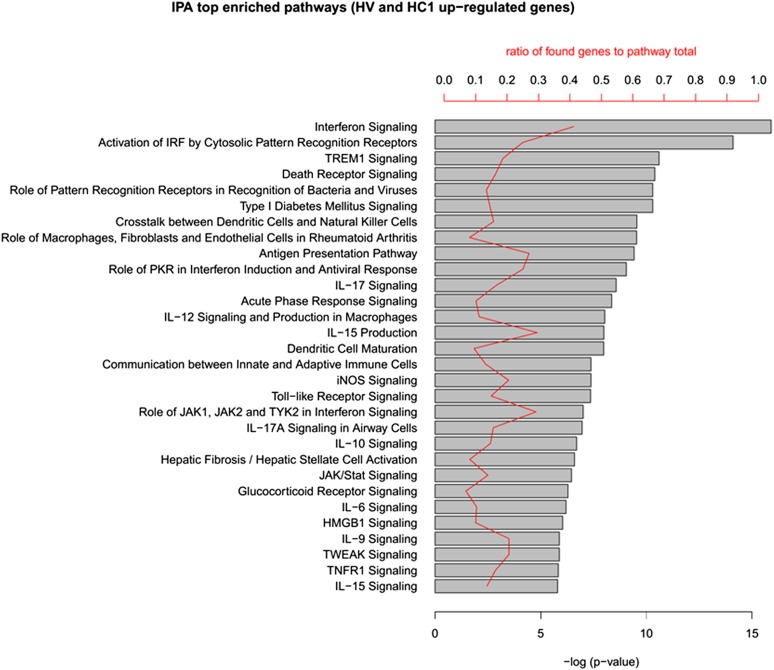
Figure 1—figure supplement 2. IPA analysis of the up-regulated genes in human islets exposed to cytokines HC1 or infected with CVB5 (HV).

Figure 1—figure supplement 2.

The up-regulated genes in HC1 and HV (348 in total) were analyzed in QIAGEN's Ingenuity Pathway Analysis (IPA) to identify enriched pathways in both cytokine-treated and virus-infected human islets. The top 30 pathways (ordered by p-value) are shown. Enrichment p-value (Fisher exact test) and ratio to the number of pathway elements are also indicated. QIAGEN's Ingenuity Pathway Analysis (IPA, QIAGEN, Redwood City, www.qiagen.com/ingenuity).
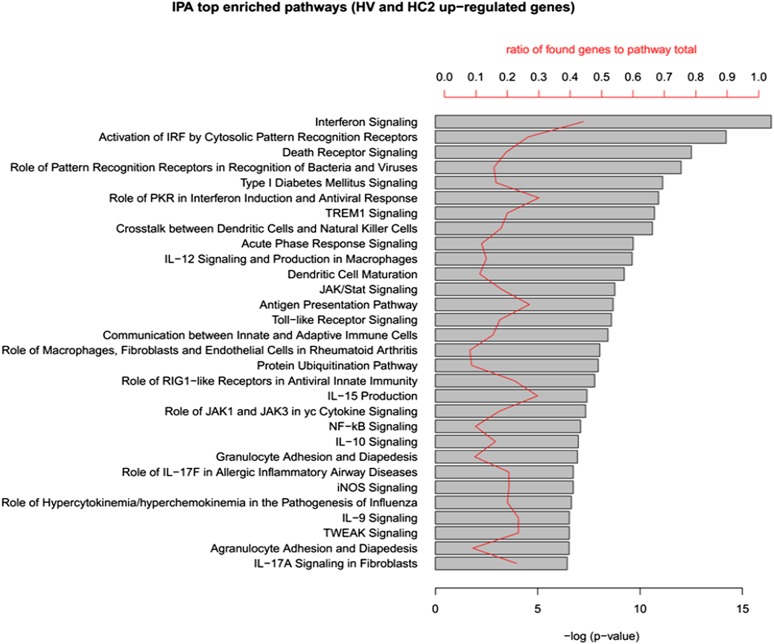
Figure 1—figure supplement 3. IPA analysis of the up-regulated genes in human islets exposed to cytokines HC2 or infected with CVB5 (HV).

Figure 1—figure supplement 3.

The up-regulated genes in HC2 and HV (413 in total) were analyzed in QIAGEN's IPA to identify enriched pathways in both cytokine-treated and virus-infected human islets. The top 30 pathways (ordered by p-value) are shown. Enrichment p-value (Fisher exact test) and ratio to the number of pathway elements are also indicated. QIAGEN's Ingenuity Pathway Analysis (IPA, QIAGEN, Redwood City, www.qiagen.com/ingenuity).