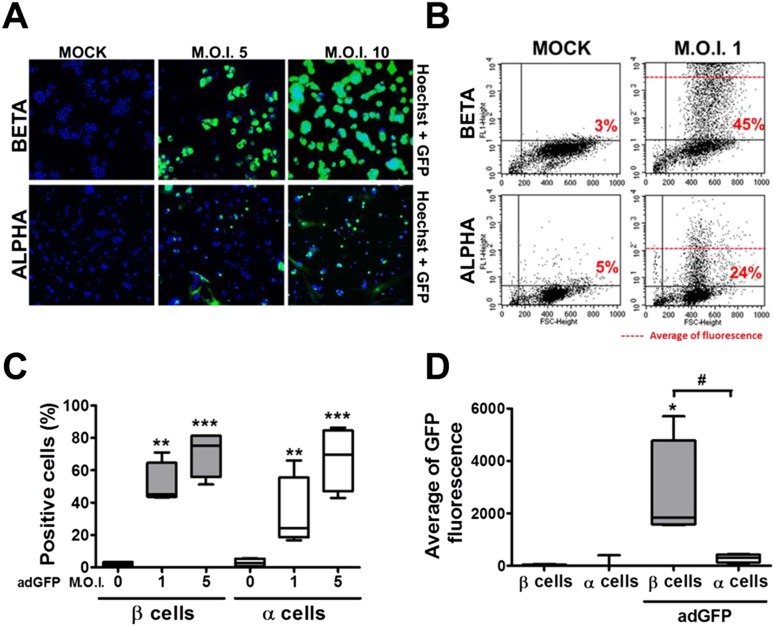
Figure 5. β and α cells are infected with similar efficiency by an adenoviral vector encoding GFP, but the translation of GFP protein is lower in α cells.
(A–D) FACS-purified β and α cells (>90% purity for both cell types) were infected with adeno-GFP (M.O.I. 1, 5 or 10) for 48 hr. Presence of GFP protein was evaluated by fluorescence microscopy (A) and flow cytometry (B–D). (A) Pictures show nucleus (blue) and GFP fluorescence (green). β and α cells were infected with adeno-GFP M.O.I. 1 or 5 (B and D) for 48 hr and then sorted based on green fluorescence and forward-scattered light. (B) Representative 2-D plot of 4 independent experiments. (C) Quantification of GFP positive cells. (D) Average of green fluorescence intensity in cells infected at M.O.I. 5. Results of 4 experiments are plotted as box plots, indicating lower quartile, median, and higher quartile, with whiskers representing the range of the remaining data points; *p < 0.05, **p < 0.01 and ***p < 0.001 adeno-GFP vs mock infection; #p < 0.05 as indicated by bars; ANOVA followed by Student's t-test with Bonferroni correction.

