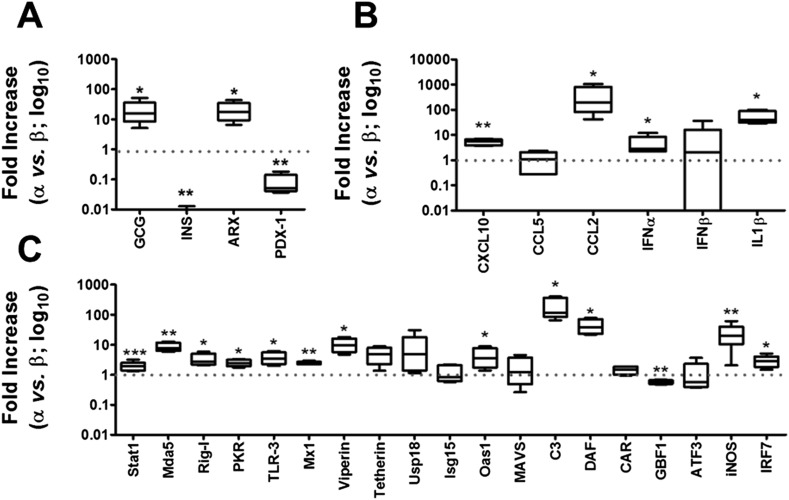
Figure 6. Basal expression of cell-autonomous immune response genes is higher in α cells than in β cells.
mRNA expression of genes related to identity of β and α cells (A) or cell-autonomous immune response (B and C) was assayed by RT-PCR and normalized by the housekeeping gene GAPDH. Graphs represent relative expression of mRNAs in α cells vs β cells (dotted line indicates 1, i.e., no change). Results from 4–9 experiments are plotted as box plots, indicating lower quartile, median, and higher quartile, with whiskers representing the range of the remaining data points; *p < 0.05, **p < 0.01, and ***p < 0.001 α cells vs β cells; Student's t-test with Bonferroni correction.

