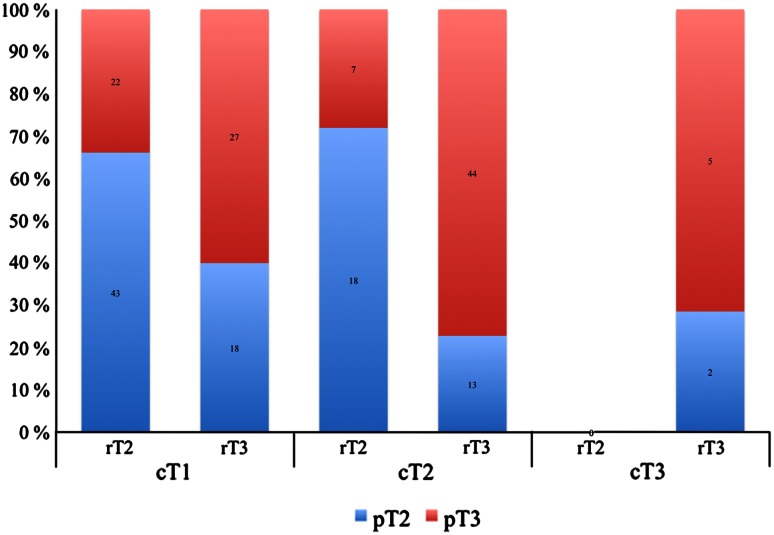
Fig. 1.
Illustrates the correlation between clinical, radiological, and pathological T classification. In patients with cT1, the sensitivity for predicting T3 disease was 55 %, specificity 70 %, and accuracy 64 %. Moreover, in patients with cT2, the sensitivity was 86 %, specificity 58 %, and accuracy 76 %. cT, rT, and pT: clinical, radiological, and pathological T classification

