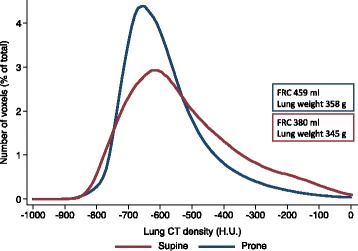
Fig. 2.

Frequency distribution of voxels in supine and prone positions. Mean number of voxels, expressed as a percentage of the total number of voxels, for every 10 H.U. changes in CT-derived lung density, in supine (red) and prone (blue) positions. The red and blue inserts refer to the mean values of FRC and lung weight in supine and prone positions, respectively. The coefficient of variation of voxel distribution was 0.32 in supine and 0.23 in prone positions
