
Fig. 1.
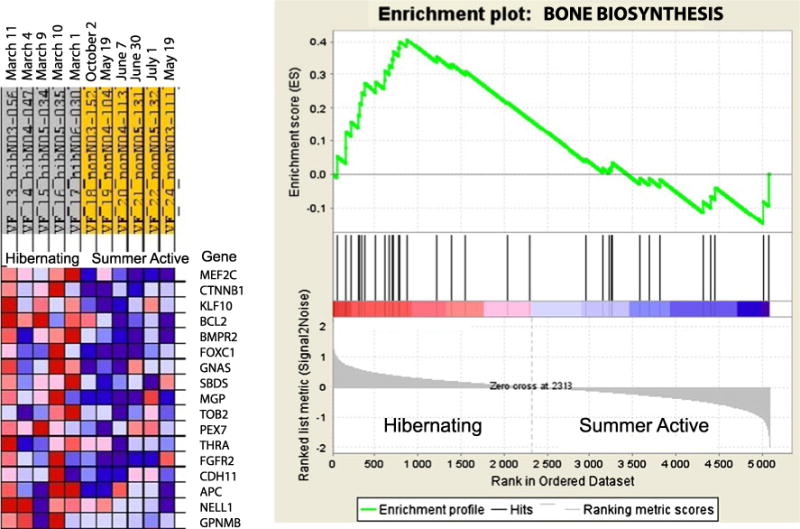
Gene set enrichment analysis results for the bone biosynthesis (ossification) category. The ossification category is enriched by upregulated genes in the ilium bone of hibernating black bears. An expression data set sorted by correlation with hibernating phenotype and the corresponding heat map with red for upregulated and blue for downregulated genes during hibernation are shown on the left. Dates on the top indicate time of tissue sampling from each bear. Plot of the running sum for enrichment score (ES) in the data set (top) and location of genes (hits) from the GO category in the list ranked according to expression differences (middle) and the ranked list metric (bottom) are shown on the right