
Figure 2.
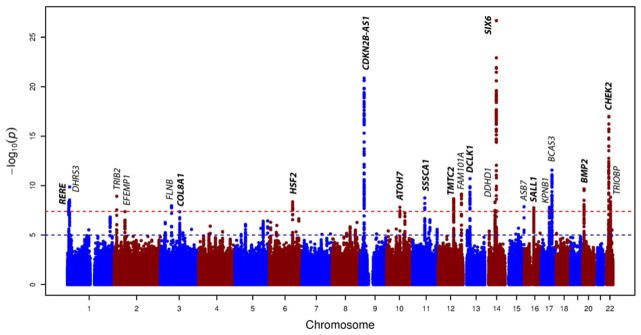
Manhattan plot of the GWAS meta-analysis for cup area (adjusted for disc area) in the combined analysis (n = 23,831 subjects of European and Asian ancestry). The plot shows −log10-transformed P-values for all single nucleotide polymorphisms. The red dotted horizontal line represents the genome-wide significance threshold of P < 5.0 × 10⁻⁸; the blue dotted line indicates P-value of 1 × 10⁻⁵. Gene loci in bold have been previously associated with cup area.