
Figure 3.
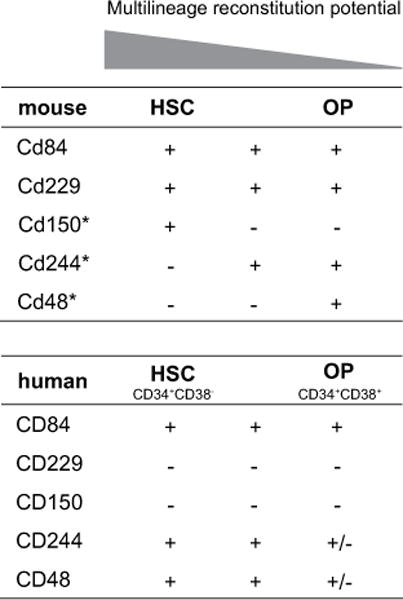
Comparison of CD150 family markers expression on bone marrow (BM) hematopoietic stem cells (HSCs) and oligo-potent progenitors (OP) between mice and humans. Results on human BM chart represent the percentage of positive cells: + (>90%), ± (75–60%) and − (<2%). *Data from Kiel et al. [6].