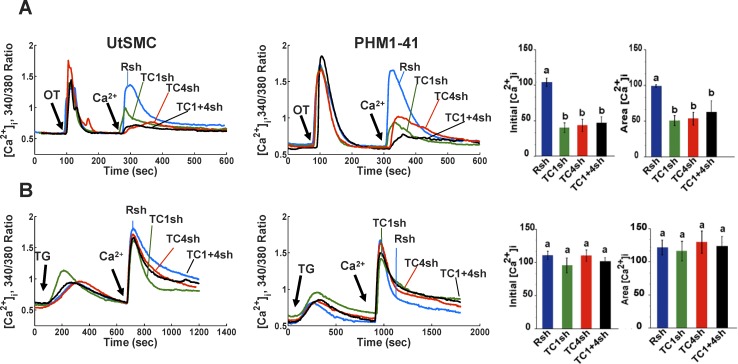
FIG. 2.
TRPC1, TRPC4, and TRPC1 plus TRPC4 mRNA knockdown induces specific inhibition of OT-stimulated SRCE in UtSMC (left panels) and PHM1-41 (middle panels) cells. A) Attenuation of SRCE induced by 100 nM OT in cells infected with a control shRNA targeting Rsh (Rsh, blue lines) or adenovirus expressing TRPC1 (TC1sh, green lines), TRPC4 (TC4sh, red lines), or TRPC1 plus TRPC4 shRNAs (TC1+4sh, black lines) is shown. The addition of 1 mM Ca2+ that initiates SRCE is indicated. Traces represent the mean responses of 10–35 cells. B) No effect of these shRNAs was observed on thapsigargin (TG, 100 nM)-stimulated SRCE. Right panels: Mean changes in [Ca2+]i (A and B), calculated as peak height (initial [Ca2+]i) and integrated area under the curve ([Ca2+]i area), are shown. As no significant differences were observed in responses from UtSMC and PHM1 cells, data from these sources were pooled for this analysis. Data are presented as means ± SEM (n = 6–8).

