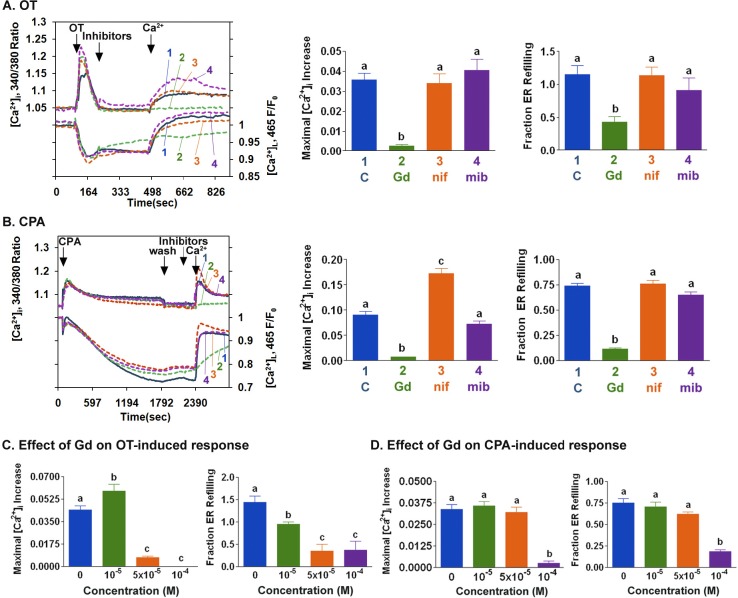
FIG. 4.
A) After stimulation with OT (100 nM) in the absence of extracellular Ca2+, PHM1-41 cells were exposed to buffer (blue line, 1), 10−4 M gadolinium (green line, 2), 10−7 M nifedipine (orange line, 3), or 10−6 M mibefradil (purple line, 4) for 4 min before the addition of 1 mM Ca2+. The traces represent the mean of responses in 35–40 cells in one of three experiments. Bar graphs summarize the effect of SRCE inhibitors on OT-stimulated responses, expressed as maximal [Ca2+]i increase and fraction of ER store refilling at 1 min. Data represent the means ± SEM of responses from 90–120 cells. B) After stimulation with CPA (10 μM) in the absence of extracellular Ca2+, PHM1-41 cells were washed with Ca2+-free buffer for 10 min (wash) and then exposed for 4 min to the same compounds as shown in A before addition of 1 mM Ca2+. Each line represents an average of the responses of 35–40 cells in one of three similar experiments. Bar graphs represent the means ± SEM of responses from 90–120 cells. A and B) Additions of OT, CPA, wash, and Ca2+ are indicated by arrows. Concentration dependence of the effect of gadolinium (Gd) on OT-induced (C) and CPA-induced (D) responses (means ± SEM, n = 35–40 cells) is shown.

