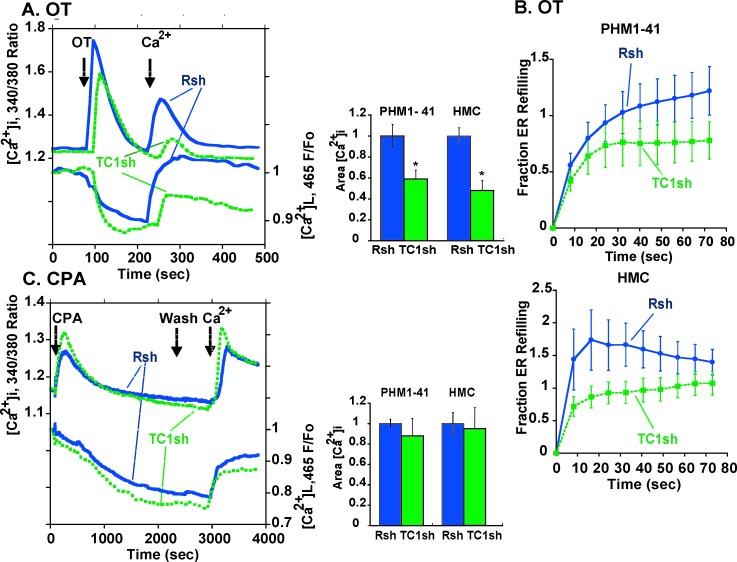
FIG. 6.
Effects of TRPC1 knockdown on SRCE and ER store depletion and refilling following treatment of myometrial cells with OT and CPA, as described in the legend to Figure 4, are shown. A) Tracings in the left panel represents the mean responses of 10–15 PHM1-41 cells infected with control virus (Rsh, blue lines) or adenovirus expressing TRPC1 shRNA (TC1sh, green lines). The middle panel presents the mean changes in integrated SRCE area in PHM1-41 and HMC cells (n = 10–11). B) The fraction of ER refilling after OT stimulation and Ca2+ addition in cells infected with control (Rsh, blue line) or TRPC1 (TC1sh, green line) shRNAs in PHM1 cells (upper graph) and HMC cells (lower graph) (n = 9–11). C) Effects of TRPC1 mRNA knockdown on CPA-stimulated responses. Data are presented as described in the legend to A (n = 4–6).

