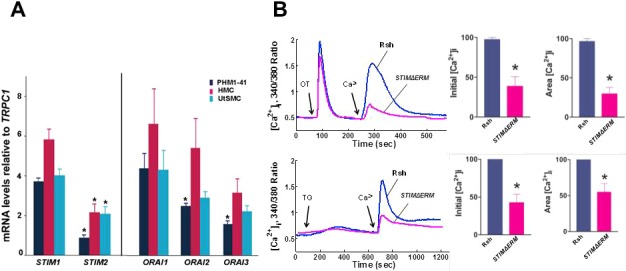
FIG. 7.

A) Relative expression of STIM and ORAI mRNA isoforms are shown in PHM1-41, HMC, and UtSMC myometrial cells, each compared to STIM1 and ORAI1 mRNA for that cell type (n = 3–4). B) STIM1ΔERM significantly inhibits OT and thapsigargin SRCE in UtSMC cells. Representative tracing (left) of mean SRCE induced by 100 nM OT or 100 nM thapsigargin (TG) in 10–15 cells infected with either control (Rsh, solid line) or adenovirus expressing STIMΔERM (dotted line) is shown. Mean changes in initial [Ca2+]i peak height (middle) and integrated SRCE area (right) compared to control (n = 5–7).
