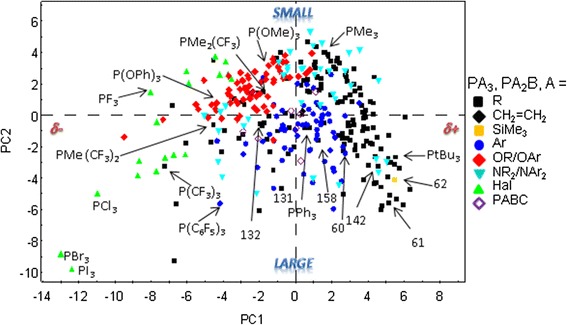
Fig. 2.

Map of ligand properties generated by principal component analysis of 28 ligand descriptors capturing the structures and energies of 348 P-donor ligands through DFT-calculated data, collected in LKB-P. [28] The principal components are linear combinations of the original descriptors derived to capture most of the variation in fewer uncorrelated descriptors (65 % in this case). Each symbol corresponds to a ligand, and shape and color are determined by substituents. Reprinted with permission from Ref. [28]. Copyright 2010 American Chemical Society
