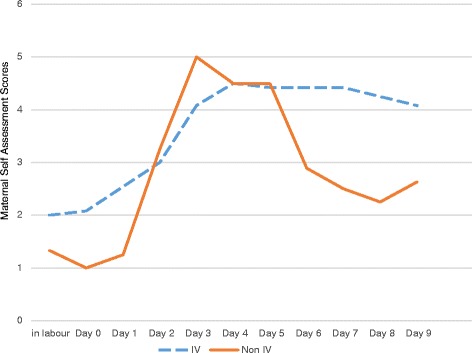
Figure 2.

Line graph showing average maternal self-assessment scores (MSA) in participants with Intravenous (IV) fluids vs. participants without IV fluids. Participants with IV fluids n = 13, participants with no IV fluids n = 4. Participants were asked to self-assess breast fullness and tenderness for each breast on a daily basis. An average daily score for each participant was then calculated and a line graph developed. This graph shows participants who had IV fluids rated their breasts more firm and tender for a longer period of time than participants who did not receive IV fluids. The blue dashed line represents participants who received IV fluids while the orange solid line represents participants who did not receive IV fluids.
