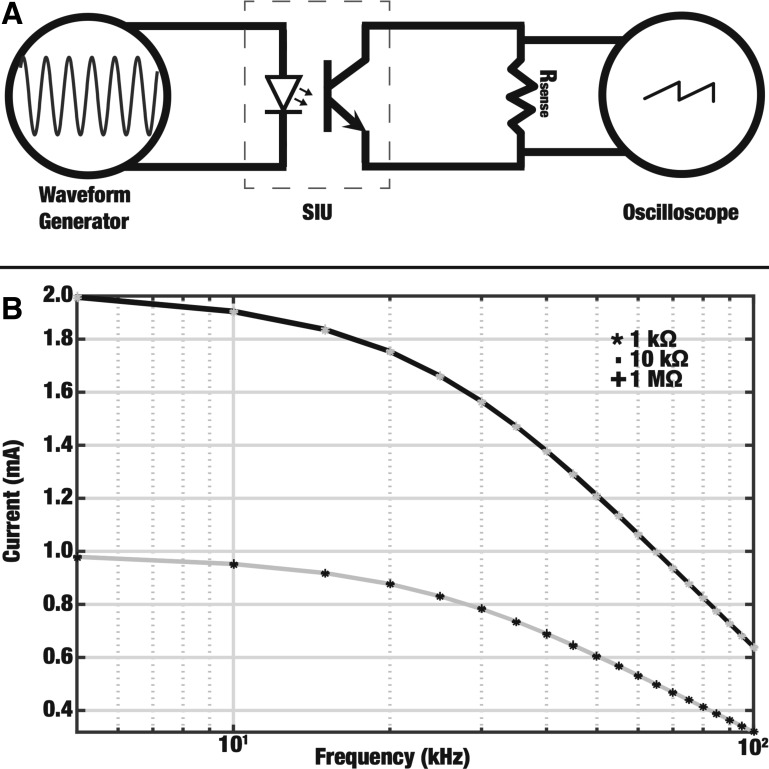
Fig. 3.
A: setup for measuring attenuated output from optically isolated stimulus isolation units (SIUs). The function generator output was connected to the input of the SIU. The SIU was set to provide an output of 1 mA/V and the output was connected to varying loads (Rsense). B: attenuation of current output by SIUs. The current across 3 different loads (Rsense) was measured at frequencies up to 100 kHz for input values of 1 V (grey) and 2 V (black). Curves for the 3 different loads at both input values overlap, showing that the attenuation is independent of the tested load and input value.

