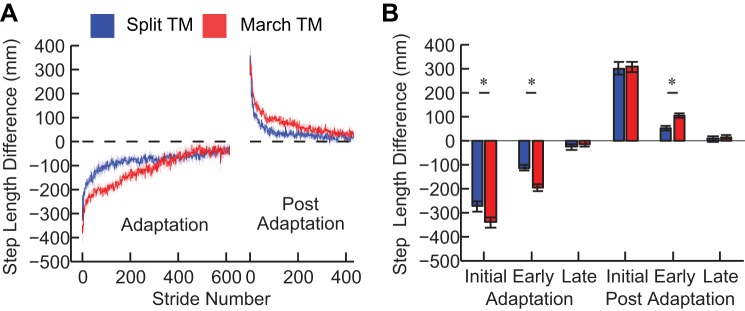
Fig. 3.

Experiment 1 results. A: mean (±SE) stride-to-stride step length difference for the SPLIT_TM and MARCH_TM groups. The step length difference is baseline subtracted on an individual basis. During adaptation, the step length difference is initially perturbed and then slowly adapted to near baseline values. During postadaptation, the belts are returned to the same speed and an aftereffect is observed in the opposite direction. B: analysis for initial adaptation, early adaptation, late adaptation, initial postadaptation, early postadaptation, and late postadaptation. *Significant differences (P < 0.05).
