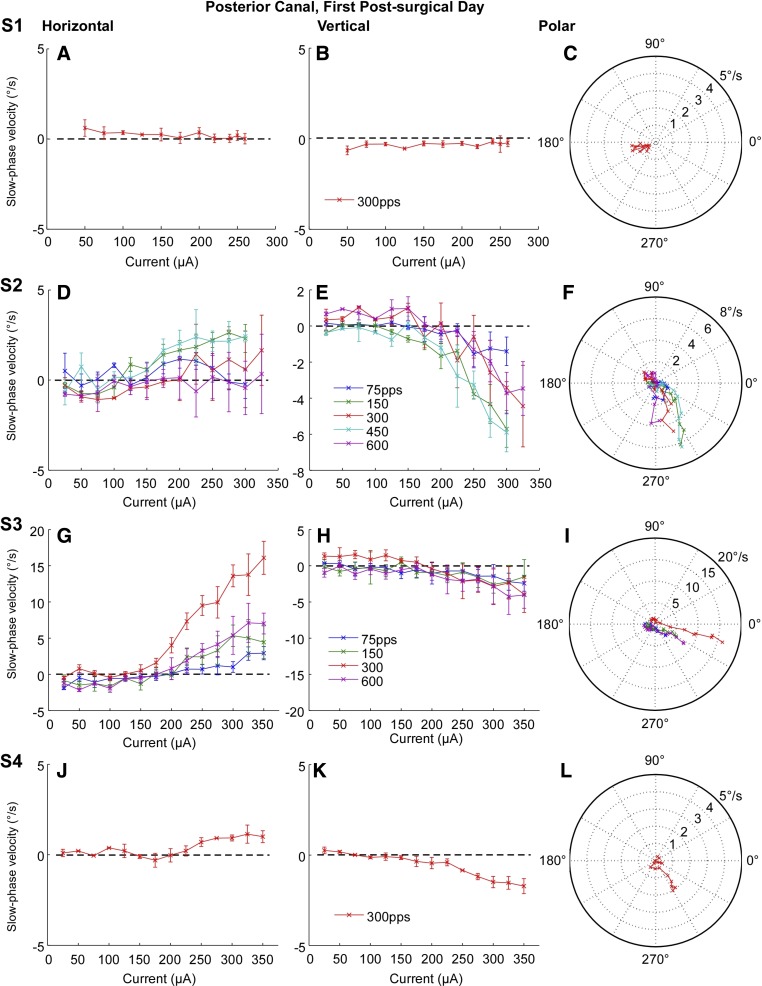
Fig. 8.
Average slow phase eye velocity vs. stimulation current at different stimulus rates for 2 s trains of biphasic pulses applied to the right posterior canal on the 1st postsurgical test day. Rows show data from different test subjects. Columns from left to right display horizontal slow phase velocity vs. current, vertical slow phase velocity vs. current, and a polar plot of 2D eye velocity vs. current. Negative values indicate leftward or downward slow phase velocity. Error bars display ± 1 SD of the slow phase velocity of all slow phases collected over all trials.

