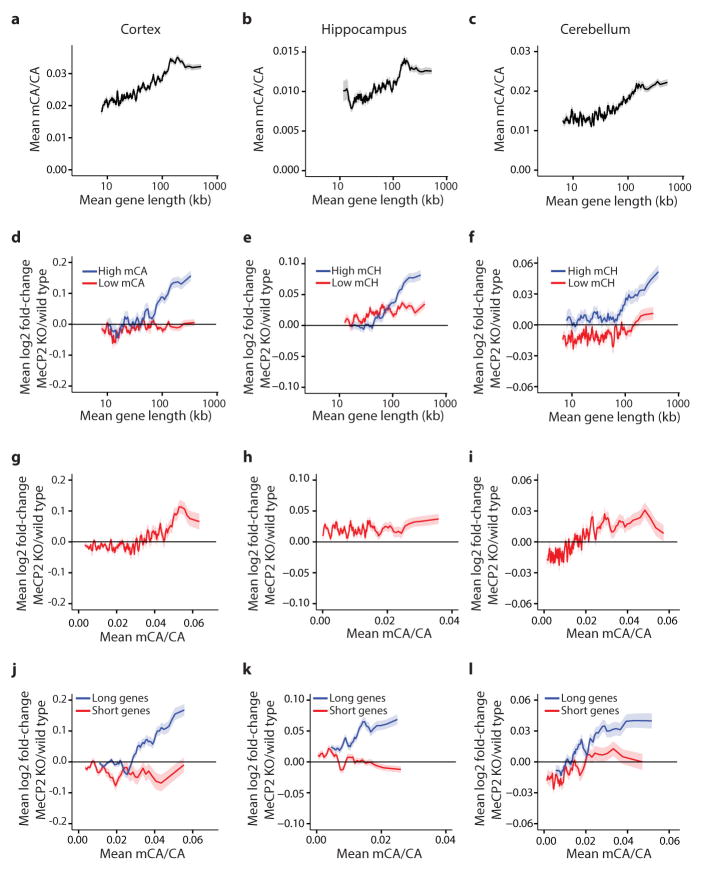
Extended Data Figure 6. Genomic analysis supports a role for mCA in length-dependent gene regulation by MeCP2.
a–c, Mean methylation at CA dinucleotides (mCA/CA) within gene bodies (TSS +3 kb to TTS) in cortex (a), hippocampus (b), and cerebellum (c) for genes binned by length. d–f, Mean changes in gene expression in cortex (d), hippocampus (e), and cerebellum (f) of MeCP2 KO for high mCA genes (top 25% mean gene body mCA/CA) and low mCA genes (bottom 66% mean gene body mCA/CA) binned by length. g–i, Mean changes in gene expression in cortex (g), hippocampus (h), and cerebellum (i) of MeCP2 KO for genes binned according to average gene body mCA/CA levels. j–l, Mean changes in gene expression in cortex (j), hippocampus (k), and cerebellum (l) of MeCP2 KO mice for long genes (top 25%) and short genes (bottom 25%) in each brain region binned by gene body mCA/CA level. A correlation between fold-change in the MeCP2 KO and mCA/CA for all genes is less prominent, or not observed, in the hippocampus and cerebellum for all genes together (h, i), but it is clear for the longest genes in the genome analyzed alone (k, l). Note that average levels of mCA appear lower in hippocampus and cerebellum compared to cortex (compare y-axis in a, b and c), and may explain why a correlation across all genes in not detected in these brain regions. In long genes analyzed alone the cumulative effect of higher mCA levels and integration across the gene may be larger, resulting in a detectable effect. In all panels, the line indicates the mean for 200 gene bins, with a 40 gene step; ribbon depicts S.E.M. for genes within each bin. Note that, for completeness, data from analysis of the cortex presented in Figure 2 are re-presented here.

