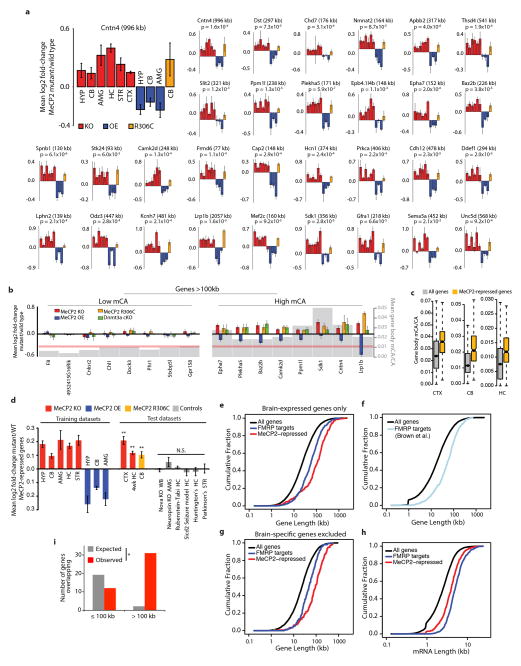
Extended Data Figure 8. Analysis of MeCP2-repressed genes and FMRP target genes.
a, Mean fold-change in mRNA expression for examples of MeCP2-repressed genes across three different Mecp2 mutant genotypes (KO, OE, and R306C) and six brain regions. p-values for each gene are derived from the mean z-scores for fold-change across all datasets (see Methods). b, Gene expression and CA methylation data from the cerebellum for selected MeCP2-repressed genes from a (right), as well as examples of extremely long genes (>100kb) that are not enriched for mCA and are not misregulated (left). Fold-changes in mRNA expression in Mecp2 mutants and the Dnmt3a cKO are shown (left axis), as well as mean mCA levels (gray; right axis). Red line indicates genomic median for gene body mCA/CA c, Boxplots of mCA levels in MeCP2-repressed genes compared to all genes. d, Mean fold-change for MeCP2-repressed genes in eight “training datasets” used to define these genes (see Methods), and nine “test datasets”: three Mecp2 mutant datasets not used to define MeCP2-repressed genes (CTX MeCP2 KO and CB MeCP2 R306C, generated in this study; HC MeCP2 KO 4wk, analyzed from Baker et al.8), and six datasets from brains of mouse models of neurological dysfunction generated using the same microarray platforms as the MeCP2 datasets (Geo accession # in order: GSE22115, GSE27088, GSE43051, GSE47706, GSE44855, GSE52584). Error bars are SEM of MeCP2–repressed gene expression across samples (n=4–8 microarrays per genotype per dataset); ** p <0.01, one-tailed t-test, Benjamini-Hochberg correction. Note that significance testing was not performed on training datasets. Brain regions indicated as in Figure 1, (WB, whole brain). e, Cumulative distribution function (CDF) of gene lengths plotted exclusively for genes that are among the top 60% of expression levels in the brain (Supplementary Discussion). The extreme length of MeCP2-repressed genes and genes encoding FMRP target mRNAs29 when controlling for expression level indicates that the long length of these genesets is not a secondary effect of the preferential expression of long genes in the brain (p < 1×10⁻¹⁵ for each geneset versus all expressed genes; 2-sample Kolmogorov-Smirnov (KS) test). f, The CDF of gene lengths for all genes compared to an independent set of FMRP targets identified by Brown and colleagues45 (p < 1 ×10⁻¹⁵, KS-test). g, CDF of gene lengths for genes expressed at similar levels in the brain and other somatic tissues (Supplementary Discussion). The extreme length of each geneset (p < 1×10⁻¹⁵, KS-test) when filtering for genes that are expressed in all tissues indicates that regulation of long genes by MeCP2 and FMRP is not dependent on brain-specific expression. h, CDF of mature mRNA lengths for MeCP2-repressed genes, and FMRP target genes (p < 1×10⁻¹¹ for each geneset versus all genes, KS-test). i, Overlap of MeCP2-repressed genes and putative FMRP target mRNAs29 (p < 5×10⁻⁵, hypergeometric test). Expected overlap was calculated by dividing the expected overlap genome-wide (hypergeometric distribution) according to the distribution of all gene lengths in the genome.

