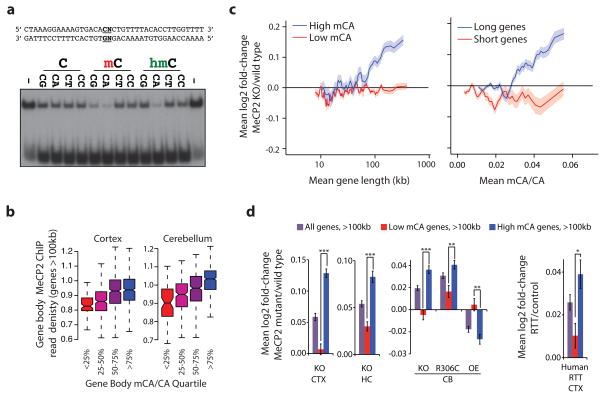
Figure 2. MeCP2 represses long genes containing high levels of mCA.
a, EMSA analysis of the MeCP2 methyl-binding domain (amino acids 78–162) binding to 32P-end-labeled mCA-containing DNA probe incubated with 100-fold excess of unlabeled competitor oligonucleotides containing unmodified, methylated, or hydroxymethylated cytosines at the dinucleotides indicated in bold; no competitor indicated by “−” (see Methods, Extended Data Fig. 3). b, Boxplots of MeCP2 ChIP-seq read density within genes >100 kb plotted by quartile of mCA/CA in the cortex and cerebellum. c, Mean fold-change in gene expression binned according to gene length in MeCP2 KO cortical tissue for genes with high (mCA/CA > 0.034, top 25%) and low (mCA/CA < 0.031, bottom 66%) mCA levels (left), or binned according to gene-body mCA/CA levels for long (>62 kb, top 25%) and short (<16.8 kb, shortest 25%) genes (right). Lines represent mean fold-change in expression for each bin (200 gene bins, 40 gene step), and the ribbon is S.E.M. of each bin. d, Bar plots of the mean fold-change in expression for all genes >100 kb compared to subsets of genes >100 kb containing low mCA (bottom 50% mCA/CA) or high mCA (top 25% mCA/CA) within their gene body. Values shown for mice with the indicated Mecp2 genotypes (left) and human RTT brain (right). CTX, Cortex; HC, Hippocampus; CB, cerebellum; KO, MeCP2 Knockout; OE, MeCP2 overexpression; R306C, MeCP2 arginine 306 to cysteine missense mutation; ***, p < 1×10⁻¹⁰; **, p < 1×10⁻³; *, p < 0.01; two-tailed t-test, Bonferroni correction. Error bars represent S.E.M.

