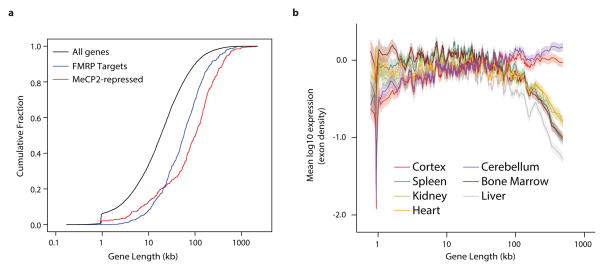
Figure 4. Analysis of long gene expression and regulation in the brain.
a, Cumulative distribution function of gene lengths for all genes in the genome (black), MeCP2-repressed genes (red), and genes encoding putative FMRP target mRNAs29 (blue); p < 1×10⁻¹⁵ for each geneset vs all genes, 2-sample Kolmogorov-Smirnov (KS) test. b, Mean expression of genes binned according to length in mouse for neural and non-neural tissues. Line indicates mean expression for genes within each bin (200 gene bins, 40 gene step); the ribbon represents the S.E.M. of each bin.

