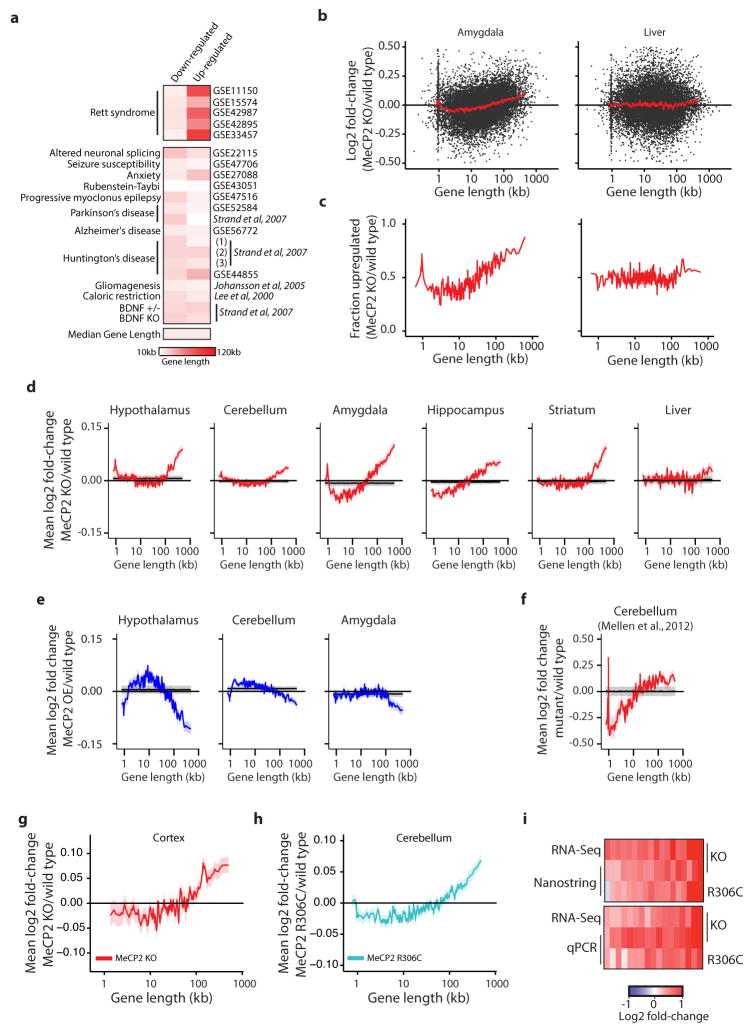
Extended Data Figure 1. Analysis of gene expression changes in Mecp2 mutant mice.
a, Heatmap of median gene lengths for genes identified as misregulated in Mecp2 mutant studies or sixteen different studies of neurological dysfunction and disease in mice. Mouse model and GEO accession number, or reference, are listed (for Strand et al. (1), 3NP treatment; (2), Human HD brain; (3), R2/6 Htt transgenic). b, Scatter plots of fold-change in gene expression in the MeCP2 KO for the amygdala (left), which shows robust length-dependent misregulation, and the liver (right), which does not. Fold-change values for genes (black points) and mean fold-change for 200 genes per bin with a 40 gene step are shown (mean, red line; ribbon, S.E.M.). c, The fraction of genes showing fold-change > 0 for datasets in b; genes binned by length (100 gene bins, 50 gene step). d–f, Analysis of published microarray5–9 (d, e) or RNA sequencing (RNA-seq)18 (f) datasets from MeCP2 KO (d, f) or OE (e) mice. Mean fold-change in expression (200 gene bins, 40 gene step), red line; ribbon, S.E.M. For d–f, mean (black line) and two standard deviations (gray ribbon) are shown for 10,000 resamplings in which gene lengths were randomized with respect to fold-change. The spike in mean fold-change at ~1 kb in several plots corresponds to the olfactory receptor genes (Supplementary Discussion). g, Mean changes in expression of genes binned by length from RNA-seq analysis of MeCP2 KO cortex (n = 3 per genotype). h, Mean changes in expression from microarray analysis of genes binned by length in MeCP2 R306C cerebellum (n = 4 per genotype) i, Heatmap summary of fold-changes in gene expression from RNA-seq analysis of Mecp2 mutant mean in g compared to Nanostring nCounter (18 genes, top) or RT-qPCR (17 genes, bottom) analysis from cortex (n=4 per genotype). Selected long genes (>100 kb) consistently up-regulated in the MeCP2 KO or down-regulated in MeCP2 OE mutant mice across brain tissues were tested (Supplementary Table 2). A statistically significant up-regulation of these genes is observed in the cortex for both MeCP2 KO (nCounter, p = 0.00073; qPCR, p < 1×10⁻¹⁵) and MeCP2 R306C (nCounter, p = 0.0482; qPCR, p = 1.69×10⁻⁶; Hotelling T2 test for small sample size37). Note that for completeness, data from other figures have been re-presented here.

