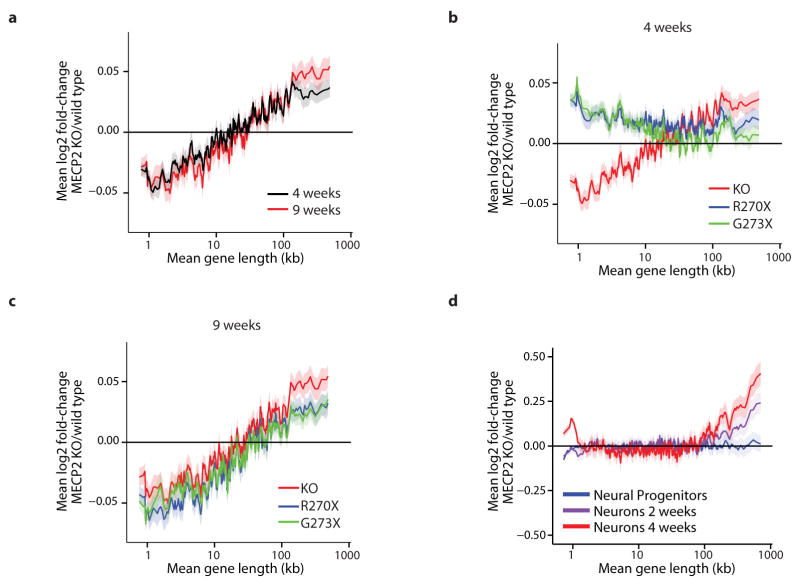
Extended Data Figure 2. Timing and severity of gene expression changes in models of RTT.
a, Mean fold-change in gene expression versus gene length in the hippocampus of MeCP2 KO mice compared to wild type at four and nine weeks of age reveals increasing magnitude of length-dependent gene misregulation that parallels the onset of RTT-like symptoms in these animals8. b, Mean fold-change in gene expression versus gene length in hippocampus of mice expressing truncated forms of MeCP2 mimicking human disease-causing alleles at four weeks of age. Re-expression of a longer truncated form of MeCP2 (G273X) in the MeCP2 KO normalizes expression of long genes more effectively than expression of a shorter truncation of MeCP2 (R270X), and parallels the higher degree of phenotypic rescue observed in MeCP2 G273X-expressing mice compared to MeCP2 R270X-expressing mice8. c, Mean fold-change in gene expression versus gene length in hippocampus of mice expressing truncated MeCP2 at nine weeks of age. Consistent with the eventual onset of symptoms of these mouse strains, length-dependent gene misregulation is evident in both strains. d, Changes in gene expression for genes binned by length in human MECP2 null ES cells differentiated into neural progenitor cells, neurons cultured for 2 weeks, or neurons cultured for 4 weeks15. In all plots, lines represent mean fold-change in expression for each bin (200 gene bins, 40 gene step), and the ribbon is S.E.M. of genes within each bin.

