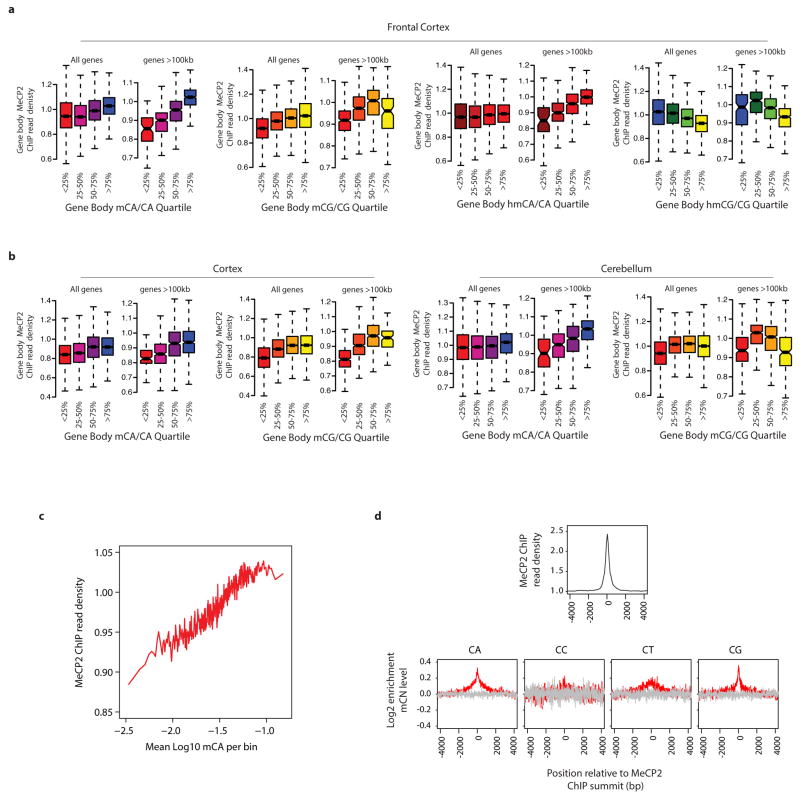
Extended Data Figure 4. ChIP-seq analysis of MeCP2 binding in vivo.
a, Boxplots of input-normalized read density within gene bodies (TSS +3 kb to TTS) for MeCP2 ChIP from the mouse frontal cortex plotted for genes according to quartile of mCA/CA, mCG/CG, hmCA/CA and hmCG/CG in the frontal cortex24 for all genes and genes >100 kb. b, Similar analysis of MeCP2 ChIP from the mouse cortex (left) or cerebellum (right) plotted for genes according to quartile of mCA/CA or mCG/CG for all genes and genes >100 kb. MeCP2 ChIP-signal is correlated with mCA/CA levels from the frontal cortex, cortex, and cerebellum for all genes and this correlation is more prominent among genes >100 kb. mCG does not show as prominent a correlation with MeCP2 ChIP signal, and hmCG trends toward anti-correlation with MeCP2 ChIP. These results suggest that MeCP2 has a lower affinity for hmCG than mCG, suggesting that, in vivo, hmCG is associated with reduced MeCP2 occupancy (Supplementary Discussion). c, High resolution analysis of high-coverage bisulfite sequencing data from the frontal cortex showing a correlation between MeCP2 ChIP signal and mCA. Input-normalized ChIP signal plotted for mCA levels for 500 bp bins tiled across all genes. d, Aggregate plots of MeCP2 input-normalized ChIP signal (top) and relative methylation (log2 enrichment in mC as compared to the flanking regions) for mCA, mCC, mCT, and mCG (bottom) are plotted around the 31,479 summits of MeCP2 ChIP enrichment identified using the MACS peak-calling algorithm40 (red) or 31,479 randomly selected control sites (gray, see Methods).

