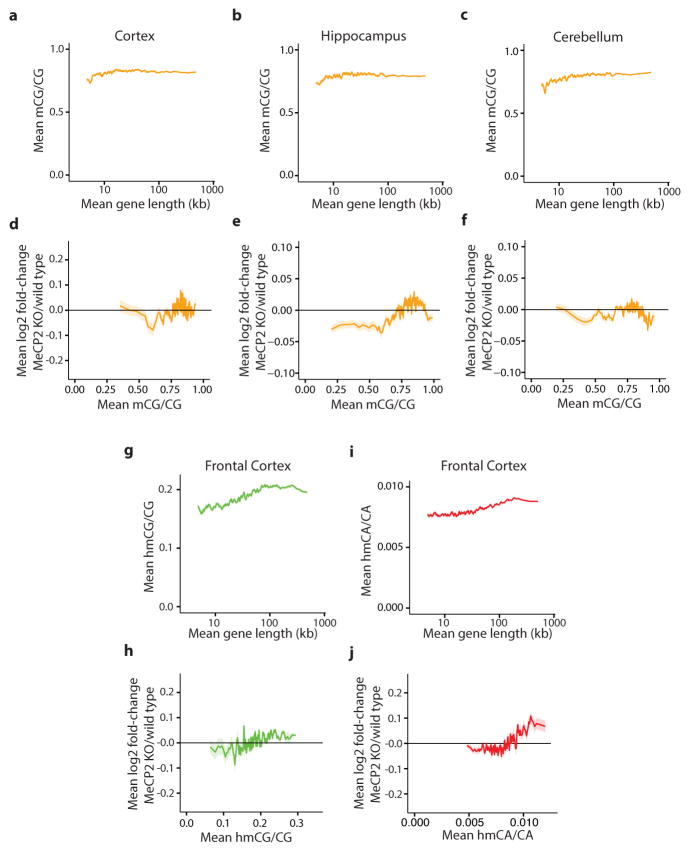
Extended Data Figure 5. Genomic analysis of mCG, hmCG, and hmCA in length-dependent gene regulation by MeCP2.
a–c, Mean methylation of CG dinucleotides (mCG/CG) within gene bodies (transcription start site +3 kb, up to transcription termination site) in the cortex (a), hippocampus (b) and cerebellum (c) for genes binned according to length. d–f, Mean fold-change in gene expression in MeCP2 KO compared to wild type in the cortex (d), hippocampus (e), and cerebellum (f) for genes binned according to mCG levels (mCG/CG) within gene bodies. g, Mean hmCG levels (hmCG/CG) within gene bodies in the frontal cortex24 for genes binned according to length. h, Mean fold-change in gene expression in MeCP2 KO compared to wild type for genes binned according to hmCG levels (hmCG/CG) within gene bodies in the frontal cortex24 i, Mean hmCA levels (hmCA/CA) within gene bodies in the frontal cortex24 for genes binned according to length. j, Mean fold-change in gene expression in MeCP2 KO compared to wild type genes binned according to hmCA levels (hmCA/CA) within gene bodies in the frontal cortex24. In all panels, mean values for each bin are indicated as a line (200 gene bins, 40 gene step); ribbon depicts S.E.M. for genes within each bin.

