
Fig. 1.
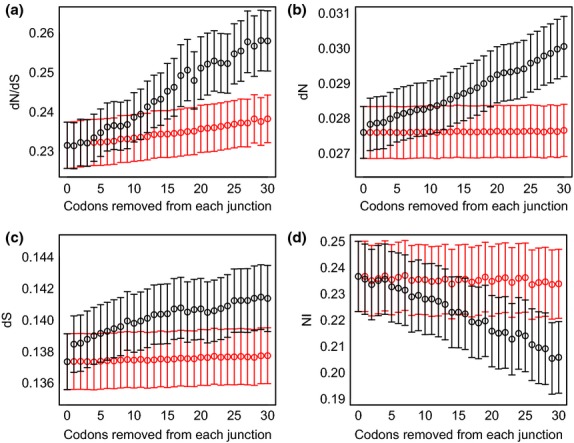
dN, dS, dN/dS and NI after exon edge removal. dN/dS (a), dN (b), dS (c) and NI (d) for a sample of 1443 genes with at least one fully alignable exon between A. thaliana and A. lyrata, after removing one codon at a time from exon edges (black), to a maximum of 30. The effects of random codon removal are shown in red. Distributions significantly differ when 30 codons are removed sequentially, but not randomly, compared to when no codons are removed. For sequential removal vs. no removal, Kruskal–Wallis P = 0.02 (dN/dS) and < 2.2 × 10⁻¹⁶ (NI). For random removal vs. no removal, Kruskal–Wallis P = 0.08 (dN/dS) and 0.49 (NI).