
Figure 4.
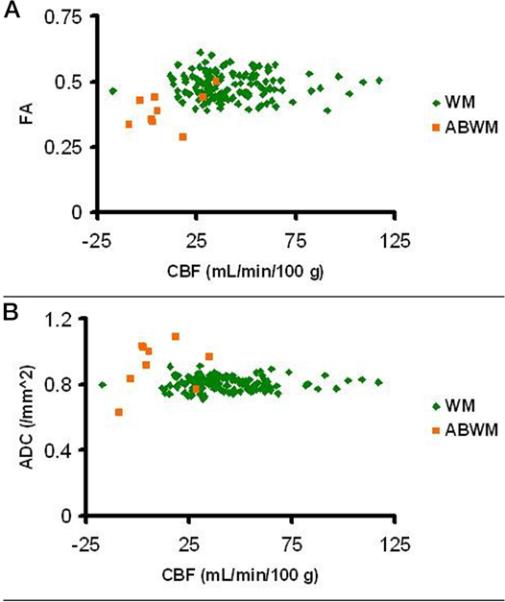
Analysis of CBF. A. Panel demonstrates fractional anisotropy (FA); B panel demonstrates apparent diffusion coefficient (ADC) in normal appearing white matter (NAWM) compared with abnormal appearing white matter (ABWM). CBF is decreased in ABWM.