
Figure 6.
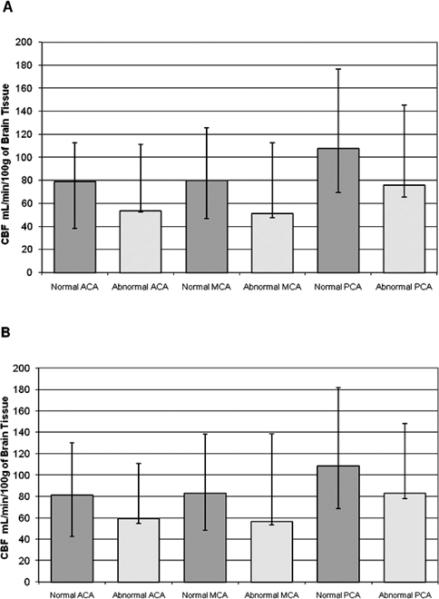
A. Regional CBF of Gray Matter-Right Hemisphere. B. Regional CBF of Gray Matter-Left Hemisphere. The median regional CBF of GM (error bars represent the minimum and maximum), comparing children normal by conventional MRI to those with white matter lacunae and or LE (abnormal cohort).