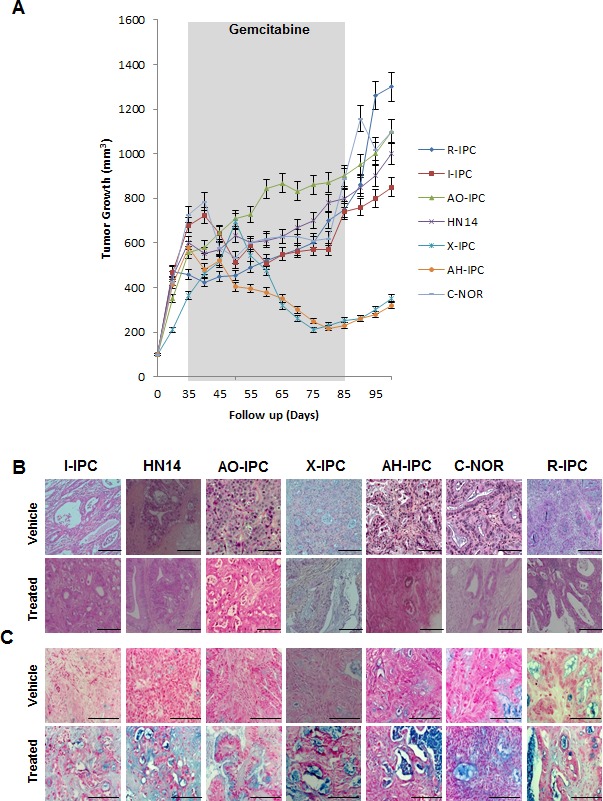
Figure 1. Heterogeneous response to gemcitabine treatment.

(A) Mice bearing primary xenografts were treated with 100 mg/kg gemcitabine, and were measured weekly for changes in tumor volume. The length of the treatment is marked in gray. (B) Various histological features were detected by H&E staining of PDAC-vehicle treated tumors (upper panel) and gemcitabine-treated tumors (bottom panel). (C) PDXs Alcian Blue staining stains acid mucosubstances and acetic mucins. Scale bar represents 100 and 50 μm. Error bars ± SEM; n=3 per group.
