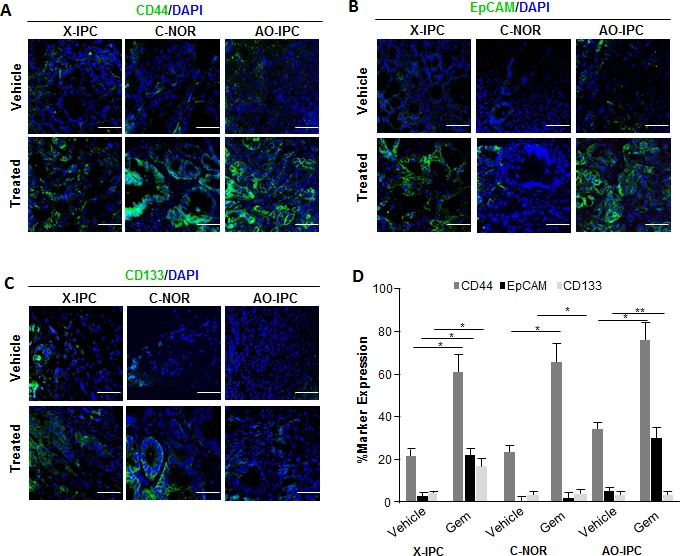
Figure 2. Expression of Cancer Stem Cell (CSC) markers in PDXs.

Immunofluorescent labeling of (A) CD44-FITC (green) and 4′,6-diamidino-2-phenylindole (DAPI), (blue); (B) EpCAM-FITC (green); DAPI (blue) and (C) CD133-FITC (green); DAPI (blue) in PDXs upon vehicle or gemcitabine treatment, show the distribution of each CSC marker in tumor tissues. (D) Quantification of the number of positive cells in each PDX. Scale bar represents 50 μm. Error bars ± SEM; n=3 per group. *P<0.05, **P<0.001 compared to vehicle treatment.
