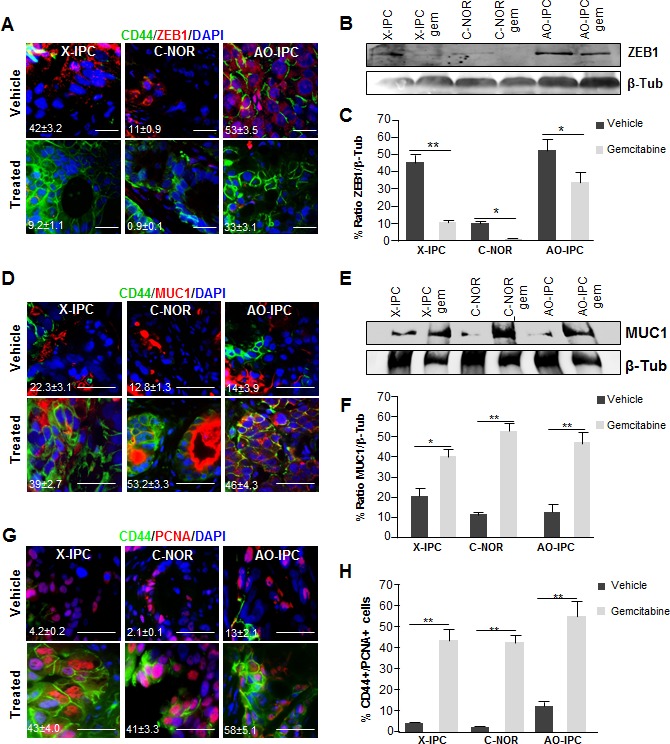
Figure 3. Deregulation of differentiation markers in PDXs after chemotherapy.

(A) Immunofluorescent analysis of CD44 (green), ZEB1 (red) and DAPI (blue) in three PDX samples treated with vehicle (upper panel) or with gemcitabine (bottom panel). (B) WB analysis for ZEB1 in protein lysates from tumor samples upon vehicle or gemcitabine treatment. (C) Quantification of ZEB1 protein expression. (D) Co-localization analysis of CD44 (green), MUC1 (red) and DAPI (blue) in PDX samples treated with vehicle (upper panel) or with gemcitabine (bottom panel). (E) WB analysis for MUC1 in protein lysates from tumor samples treated with vehicle or with gemcitabine. (F) Quantification of the expression of the MUC1 protein in tumor samples. (G) Immunofluorescent labeling of PCNA (red), CD44 (green) and DAPI (blue) in PDXs vehicle or treated with gemcitabine. The CD44+/PCNA+ ratio is shown on the left side (H). Scale bar represents 10 μm. Error bars ± SEM; n=3 per group. *P<0.05, **P<0.001 compared to vehicle treatment.
