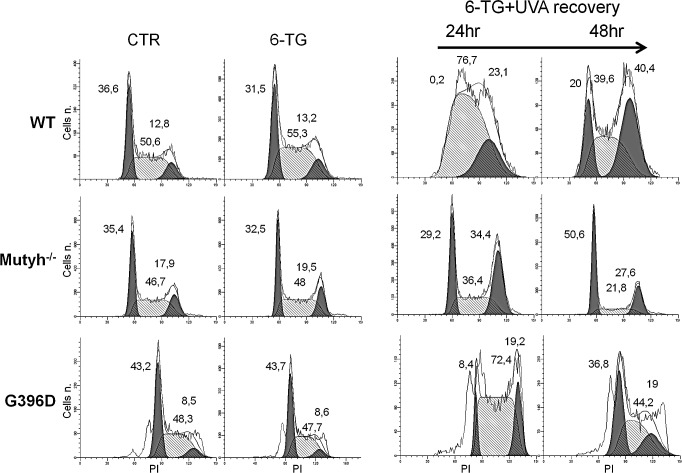
Figure 3. Cell cycle analysis after 6-TG/UVA.
Cell cycle progression in WT, Mutyh−/− and G396D-expressing MEFs. Cells were grown for 24h in 0.6μM 6-TG or 6-TG followed by UVA irradiation and sampled for analyses at the indicated time points. The percentage of cells in G1, S and G2 phases of the cell cycle are also indicated.

