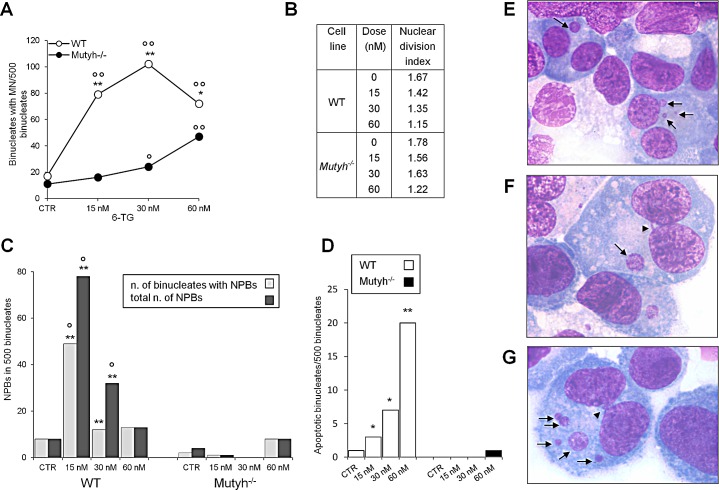
Figure 5. Chromosomal damage after 6-TG/UVA treatment.
A) Induction of MN by exposure to 6-TG/UVA. Number of binucleated cells with MN in WT (white circles) and Mutyh−/− (black circles) MEFs following 6-TG/UVA treatment (48h growth at various doses of 6-TG followed by UVA irradiation). *P<0.05, **P≤0.001 (χ² test: WT vs Mutyh−/−). °P<0.05; °°P<0.001 (χ² test: treated vs control). B) Nuclear division index relative to WT and Mutyh−/− MEFs cultivated in increasing 6-TG concentrations and UVA irradiated. C) Induction of NPBs by exposure to 6-TG/UVA. Number of binucleated cells with NPBs (light gray) and total number of NBPs (dark gray) in WT and Mutyh−/− cells MEFs exposed to 6-TG/UVA (experimental conditions as described in A) **P<0.001 (χ² test: WT vs Mutyh−/−). °P<0.001 (χ² test: treated vs control). D) Number of apoptotic binucleated cells in WT (white bars) and Mutyh−/− (black bars) MEFs following 6-TG/UVA (experimental conditions as described in C). *P<0.05, **P≤0.001 (χ² test: WT vs Mutyh−/−). E) A representative image of MN (indicated by arrows) in the cytoplasm of two binucleated cells. F) A representative image of an NPB connecting two nuclei in the same cell (arrowhead). In the same binucleated cell a MN is also visible (arrow). G) A representative image of an apoptotic binucleated cell containing five MN (arrows) and one NPB (arrowhead). All images are X 1000.

