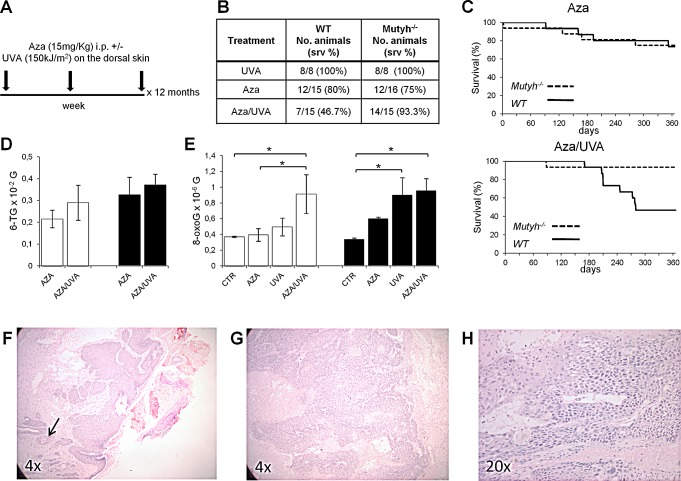
Figure 6. Survival, skin DNA 8-oxoG levels and tumor onset in WT and mice treated with Aza/UVA.
A) Schematic representation of the treatment. B) Summary of survival data of WT and Mutyh−/− mice treated with Aza, UVA or the combined treatment as indicated in A). C) Kaplan–Meier curves of Aza and Aza/UVA treated WT (solid line) and Mutyh−/− (dotted line) mice. D) DNA 6-TG levels in the skin of WT (white bars) and Mutyh−/− (black bars) mice following Aza or Aza/UVA combined treatment. Data are mean ± SE of 11-19 animals/genotype. E) DNA 8-oxoG levels in the skin of WT (white bars) and Mutyh−/− (black bars) mice following Aza, UVA or combined treatment. Data are compared to historical controls (CTR) and they are mean ± SE of 16-25 animals/genotype. *P≤0.05 (Student's t-test). F - H) Representative histological images of SCCs from two Aza/UVA treated Mutyh−/− mice. F) Well-differentiated Grade I SCC showing full thickness epidermal atypia and involvement of hair follicles. Keratinization-induced “pearl-like” structures (dermal nests of keratinocytes attempting to mature in a layered fashion containing keratinizing cells and horny pearls) are indicated by an arrow. G) Poorly-differentiated Grade III/IV SCC. H) A higher magnification of the tumor shown in G).

