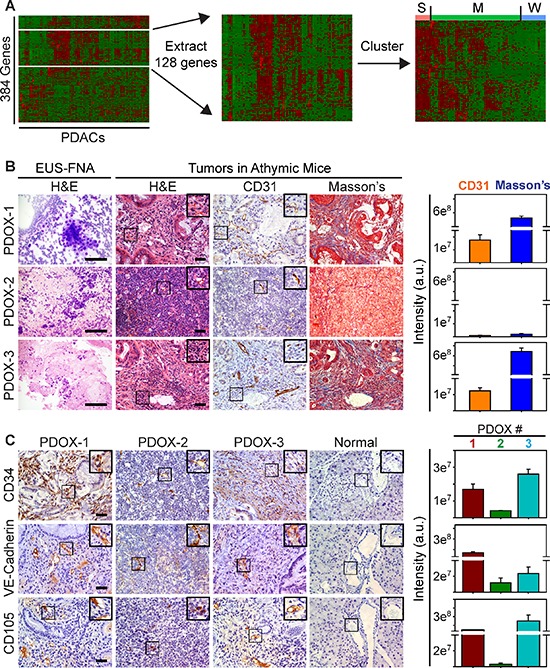
Figure 1. A Subset of Human PDACs exhibit a strong angiogenic gene signature.

(A) Hierarchical clustering of TCGA data show that genes annotated to angiogenesis (white lines) are up-regulated in some human PDACs (left). Extraction (middle) and re-clustering (right) shows that many of these angiogenesis genes are up-regulated in a subset of PDACs (S = strong), whereas some (M = moderate) or few of these genes (W = weak) are increased in other PDACs. (B) H&E staining shows cytology of EUS-FNA samples (left) and histology of EUS-PDOX tumors in athymic mice. CD31 immunohistochemistry shows that EUS-PDOX tumors harbor ECs in the collagen-rich stroma highlighted by Masson's Trichrome staining of serial sections. (C) Human-specific CD34 (top), VE-Cadherin (middle) and CD105 (bottom) antibodies react with ECs in EUS-PDOX tumors, but fail to react with ECs in normal murine pancreata. Quantitation (right) of CD31 and Masson's Trichrome (B), or CD34 (upper), VE-Cadherin (middle) and CD105 (lower panel) (C) pixel intensity shows that stroma content and the abundance of ECs in PDOX2 are decreased compared with PDOX1 and PDOX3. Shown in (B–C) are representative images from three EUS-PDOX tumors. Insets show magnified images of boxed areas. Scale bars, 50 μm.
