
Figure 4. Glutamine metabolism is switched from GLS2 to GLS1 during oncogenic transformation to HCC.
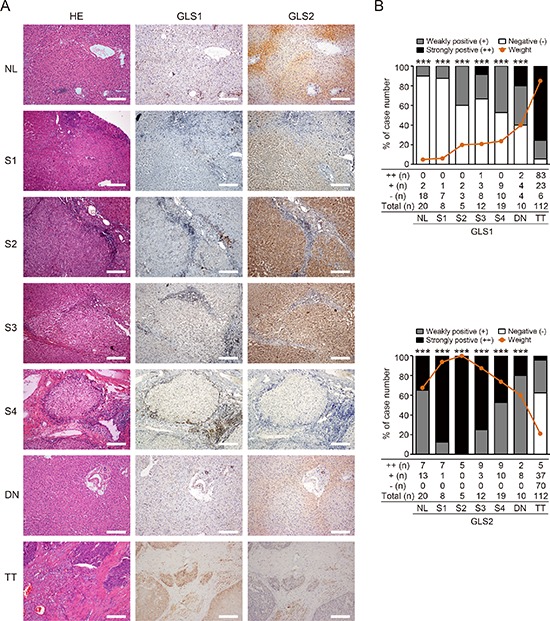
(A) HE and immunohistochemical staining for GLS1 and GLS2 in normal liver tissues (NL, n = 20), fibrotic liver tissues from Grade I to V (S1–S4, n = 44), dysplastic nodule tissues (DN, n = 10), and HCC tumor tissues (TT, n = 112). Staining of representative sections are shown. Bars = 200 μm. (B) Quantitation of intensity and frequency of GLS1 (upper panel) and GLS2 (lower panel) expression. The intensity was scored as 2 (strongly positive), 1 (weakly positive), or 0 (negative). Brown lines indicate aggregate positivity in different tissues, calculated according to the frequency and intensity: ∑ Frequency × Intensity/2. ***p < 0.001.