
Figure 5. Expression of GLS1and GLS2 correlate with survival times of HCC patients.
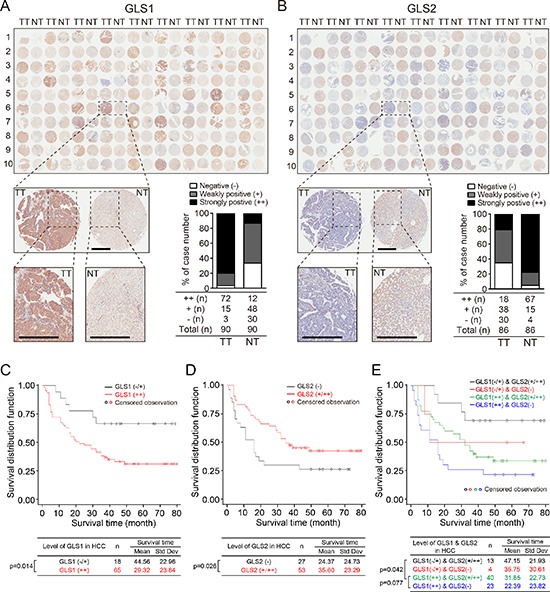
(A and B) Expression of GLS1 and GLS2 determined by immunohistochemical staining in tissue arrays containing tumor and paired adjacent non-tumor tissues from 90 HCC patients. Insets show higher magnifications of stainings of one set of paired tissues. Bars = 500 μm. Histograms show quantitation of expression and intensity of staining of all samples. Intensity of staining was classified into three grades: ++ strongly positive, + weakly positive, and − negative. (C and D) Survival curves of 90 HCC patients divided into 2 groups according to staining intensity. (C) GLS1 survival curves. Black line: low/non-expression (−/+); red line: high-expression (++). (D) GLS2 survival curves. Black line: non-expression (−); red line: expression (+/++). Kaplan–Meier survival curves were based on time to death from disease or on time to biochemical recurrence (BCR). (E) Survival curves of 90 HCC patients based on combined GLS1 and GLS2 expression. Black line: GLS1 −/+ and GLS2 +/++ (n = 13); red line: GLS1 −/+ and GLS2 − (n = 4); green line: GLS1 ++ and GLS2 +/++ (n = 40); blue line: GLS1 ++ and GLS2 − (n = 23). Kaplan–Meier survival curve based on time to death from disease or on time to biochemical recurrence (BCR).