
Figure 2. 1,25(OH)2D3 induces miR-145 expression in gastric cancer cells.
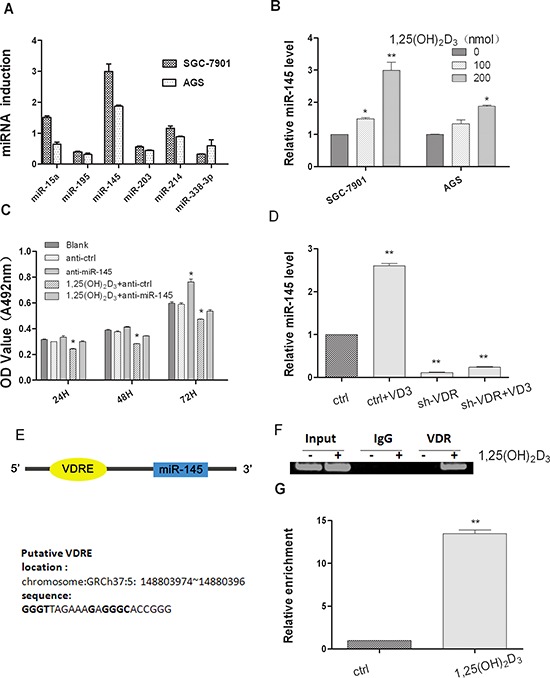
(A) SGC-7901 cells and AGS cells were both treated with 200 nM 1,25(OH)2D3 for 48 hours and total RNA was isolated from the cells and qRT-PCR analysis of miRNAs fold change was performed as described in Materials and Methods. (B) qRT-PCR analysis of miR-145 was quantified, and values are expressed as -fold change (C) miR-145 inhibitor or ASO-NC transfected SGC-7901 cells were treated with 500 nM calcitriol, Cell growth was determined at 24, 48 and 72 hour time points by MTT assay. (D) Empty vector or sh-VDR transfected SGC-7901 cells were treated with 200 nM calcitriol for 24 hours, total RNA was isolated and qRT-PCR analysis was performed. (E) Lists of the putative VDRE sequences and the human miR-145 locus in chromosome5. (F) The in vivo interaction of VDR with miR-145 VDRE was shown. SGC-7901 cells were treated with 500 nM 1,25(OH)2D3 or blank control for 48 hour, and ChIP assays were performed with control (rat IgG), anti-VDR antibody. (G) qRT-PCR analysis was performed with primers spanning predicted VDRE of miR-145. All qRT-PCR results are expressed as mean ± SEM from at least three independent experiments. (*p < 0.05; **p < 0.01.)