
Figure 5. E2F3 and CDK6 are both direct targets of miR-145.
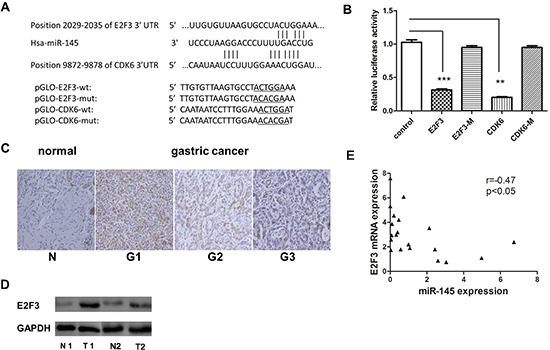
(A) Scheme of the potential binding sites of miR-145 in the 3′ UTR of E2F3 and CDK6. (B) Luciferase assay in SGC-7901 cells. Pre-miR-145 was cotransfected with target gene reporter construct (WT or MUT version of pGLO constructs) or NS-control. Luciferase activity in pGLO-E2F3 and pGLO-CDK6 group displayed a significant decrease following ectopic expression of miR-145. (*p < 0.05; **p < 0.01; ***p < 0.001, Student's t-test) (C) E2F3 protein expression level measured by IHC in gastric cancer tissue (G1, poorly differentiated;G2 moderately differentiated;G3 well differentiated) (D) E2F3 protein level measured by western blotting in GC and adjust normal tissue, 2 paired sample presented. (E) Inverse correlation between miR-145 and E2F3 expression in GC tissues. Statistical analysis was performed using Pearson ’ s correlation coefficient (r = − 0.47, *P < 0.05).