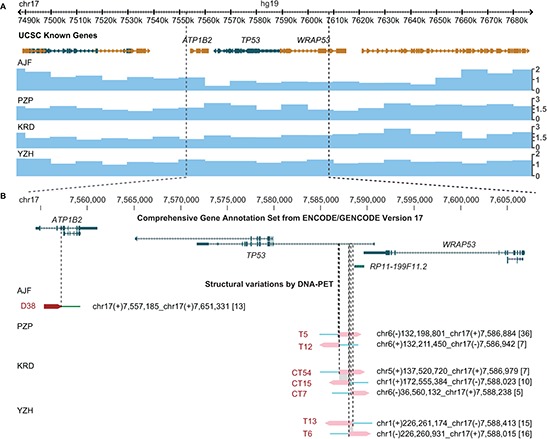
Figure 1. Translocation hotspot in intron 1 of TP53 in OS samples.

(A) Genes derived from the UCSC known genes database [43] (top) and copy number information derived from DNA-PET sequencing data of four OS samples (blue tracks, bottom) are shown in the Genome Browser. Genes transcribed from the plus strand are represented in gold, genes transcribed from the minus strand are represented in green. Boxes indicate exons, barbed lines indicate introns. The TP53 locus for patients PZP, KRD, and YZH has a copy number of two while patient AJF shows loss of one copy. (B) Enlargement of gene (top) and breakpoint (bottom) view of the TP53 locus. GENCODE transcripts with unresolved problems have been excluded. Note that TP53 is transcribed on the minus strand (from right to left). Mapping regions of DNA-PET sequence tags which represent a rearrangement are shown as dark red (5′-tags) and pink (3′-tags) arrow heads with the predicted breakpoint being located at the tip of the dark red and the base of the pink arrow heads (dashed lines). SV identifiers are in red letters, predicted breakpoint locations and connections are indicated for each rearrangement in black letters. Numbers in squared brackets indicate number of PETs which connect the two genomic regions of a SV (dPET cluster size). Shaded in gray are stretches of identical sequences for both breakpoint sides.
