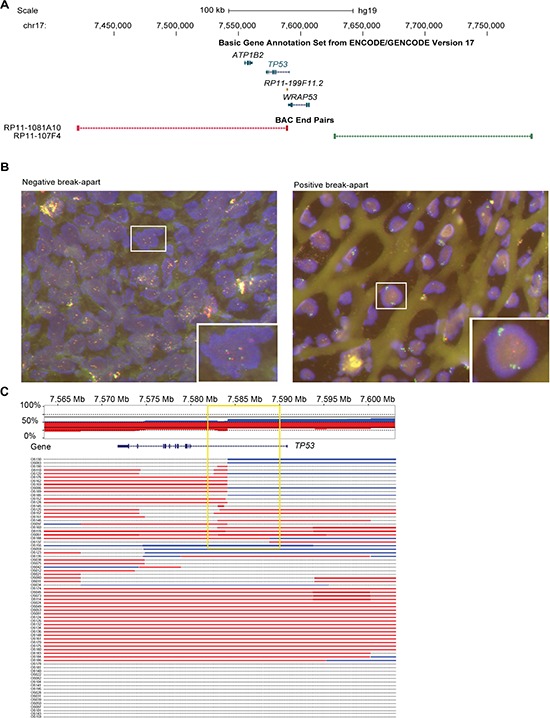
Figure 2. Translocation hotspot in intron 1 of TP53 in OS samples.

(A) Location of BAC clones which have been selected for FISH relative to TP53 and immediate neighbouring genes. Other genes of the track have been deleted for clarity. Color code matches fluorophore of FISH analysis shown in B. (B) Examples of a negative and positive break-apart signal of two color FISH which has been used to screen 267 formalin fixed and paraffin embedded (FFPE) OS samples and 141 other bone-forming tumors. (C) Copy number overview of 73 OS tumors at the TP53 locus based on CytoScan array analysis. Top panel shows the cumulative copy number across all samples with red indicating loss and blue gain in copy number. Lower panel shows the copy number gains and losses for each of the 73 OS tumors individually. Note the changes in copy number within intron 1 of TP53 detectable in 23 cases (yellow box).
