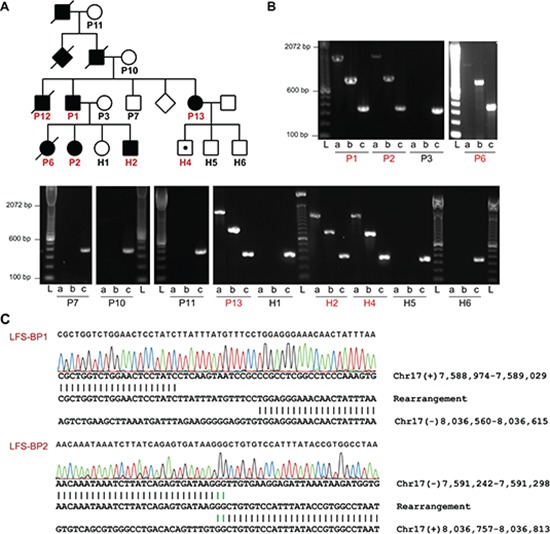
Figure 3. TP53 intron 1 rearrangement in a family with LFS.

(A) Pedigree of a family with LFS. Squares and circles represent males and females, respectively. Filled symbols indicate individuals with early onset cancer. Symbols with a diagonal line indicate that the individual was deceased at the time of recruitment. Diamonds represent several additional family members whose gender should not be disclosed. Individuals of whom DNA samples have been obtained are numbered with individuals tested positive for TP53 exon 1 deletion by MLPA in red. TP53 rearrangement carrier without cancer at the age of 10 years is indicated by a white symbol with a black dot. (B) PCR analysis of positive control and TP53 intron 1 rearrangement points (LFS-BP1 and LFS-BP2) of family members of whom high quality DNA was available. DNA quality of P12 did not allow PCR amplification, including positive control (not shown). a, LFS breakpoint 1 (BP1); b, LFS breakpoint 2 (BP2); c, positive control amplicon at the RNA polymerase II locus (POLR2A); sample IDs correspond to A with affected individuals in red. L, ladder. (C) Sanger sequencing of rearrangement points LFS-BP1 and LFS-BP2 at the TP53 locus of P2. Micro homologies between the two participating break point regions are illustrated by green vertical lines. Genomic coordinates are based on NCBI build 37.
