
Figure 1. Cell cycle analysis of irradiated MSC.
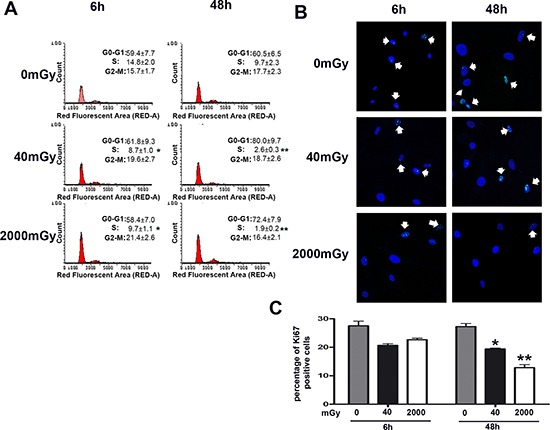
Panel (A) – The picture shows representative FACS analysis of irradiated (40 and 2000 mGy) and control MSC. The experiments were carried out six and 48 hours post-irradiation. Experiments were conducted in triplicate for each condition. Percentage of different cell populations (G1, S and G2/M) are indicated. Data are expressed with standard deviation (n = 3, *p < 0.05, **p < 0.01). Panels (B, C) – Representative microscopic field of Ki67 immunostaining (green) on MSC six and 48 hours post-irradiation with 40 and 2000 mGy. Nuclei were counterstained with Hoechst 33342 (blue). Arrows indicate Ki67-positive cells. The graph shows the percentage of Ki67-positive cells. Data are expressed with standard deviation (n = 3, *p < 0.05, **p < 0.01).