
Figure 5. Gamma H2AX staining.
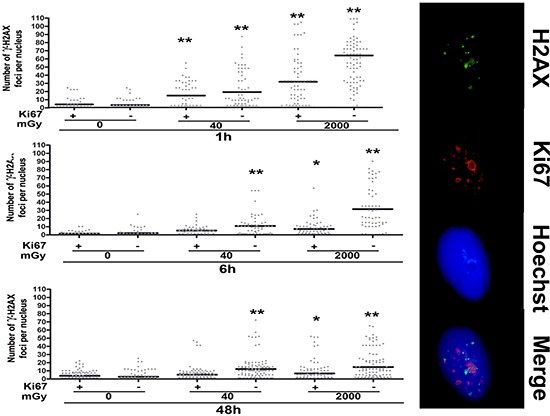
Fluorescence photomicrographs show the merging of cells stained with anti-H2AX (green), anti Ki-67 (red) and Hoechst 33342 (blue). A representative microscopic field for each treatment is shown. – Graph shows the degree of H2AX phosphorylation. This was evaluated by counting the number of gamma-H2AX immunofluorescent foci per cell. Foci number was determined for 200 cells. Each dot represents an individual cell. Black bars indicate mean value for each category (n = 3, *p < 0.05, **p < 0.01).