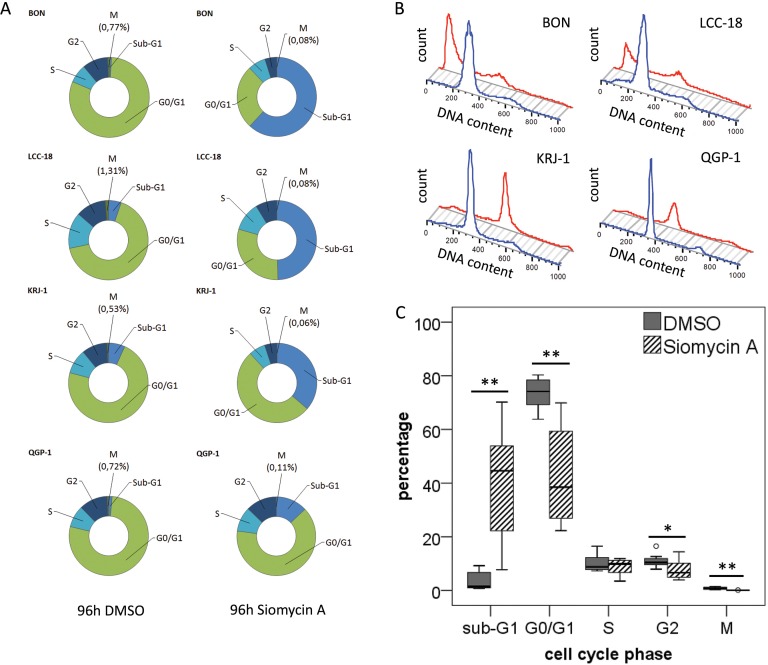
Figure 5. Cell cycle analysis of GEP-NEN cell lines treated with siomycin A.
Unsynchronized BON, QGP-1, KRJ-1, LCC-18 cells were treated with 2μM siomycin A for 96h and analyzed by mitotic index flow cytometry. Cells were stained with an anti-phospho-H3 antibody and propidium iodide and analyzed versus 0.04% DMSO controls. All changes were calculated with respect to DMSO controls. A. Average of cell cycle changes in the distinct GEP-NEN cell lines after Siomycin A treatment. BON cells show a strong 72-fold increase in the sub-G1 cell death population; in KRJ-1, QGP-1 and LCC-18 cells a 5- to 9-fold increase could be detected. Most notably, the number of mitotic cells (indicated by phosphorylated histone H3) significantly decreases after siomycin A treatment in the range of 6.5- to 16-fold. B. Representative histogram of one 96h incubation experiment, blue line indicates the DMSO control, red lines visualizes the cell cycle histogram after siomycin A treatment (more detailed flow cytometry data can be found in Suppl. 2). The average chances of all cell lines under siomycin A treatment are visualized in C., all significant values are indicated by stars. Double starred bars indicate significance levels P≤1%.

