
Figure 7. Effect of ILK inhibition by treatment with T315 on PC-3 xenograft tumors.
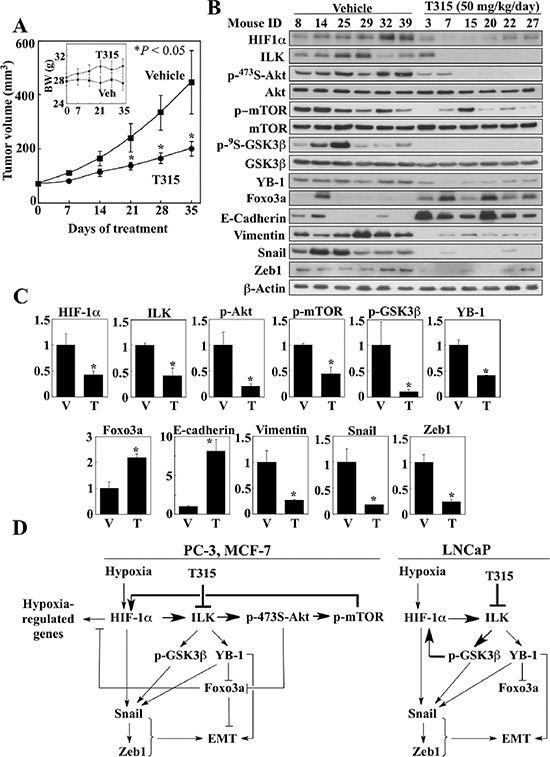
(A) Effect of T315 (p.o., 50 mg/kg, once daily) on PC-3 tumor growth in nude mice (n = 8). Inset, average body weights of each treatment group during the study. Data are presented as means ± S.E. (*p < 0.05 compared to vehicle). (B & C) Western blot analysis of the phosphorylation/expression levels of relevant markers in six representative tumors from each treatment group. (B) Immunoblots. (C) Relative expression levels of the various markers based on densitometric quantitation of band intensities. Data are presented as means ± SD (*p < 0.05 compared to vehicle). T, T315; V, vehicle. (D) Diagrams depicting the mechanisms by which ILK inhibition regulates HIF-1α expression and reverses the mesenchymal phenotype of cancer cells under hypoxic conditions.