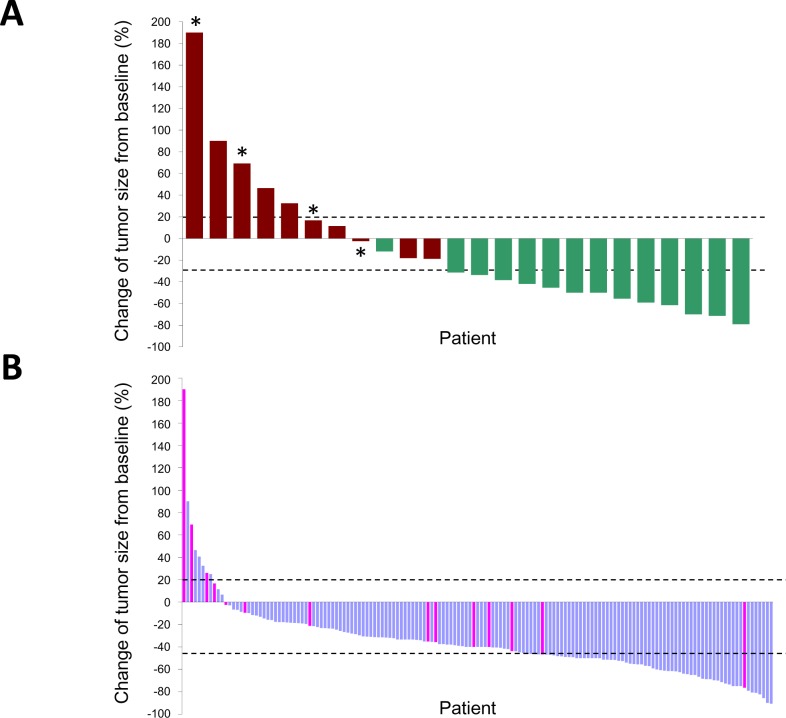
Figure 3. Waterfall plots of the maximum percentage change in tumor size of individual EGFR L858R lung adenocarcinomas treated by EGFR-TKIs.
Tumors are listed in order of increasing extent of response to EGFR-TKIs; only those with measurable sizes before and after EGFR-TKI treatment are shown. The upper (20%) and lower (−30%) dashed lines indicate the thresholds used to define a progressive disease and a partial response, respectively, by the RECIST criteria. Panel A shows individual tumor responses in 24 patients analyzed by NGS. Red bars, PFS < 3 months; green bars, PFS < 1 year; asterisks, positive for MHL1 V384D. Panel B shows 155 EGFR L858R tumors analyzed for MLH1 status by direct sequencing of PCR products. Pink bars, positive for MLH1 V384D.

