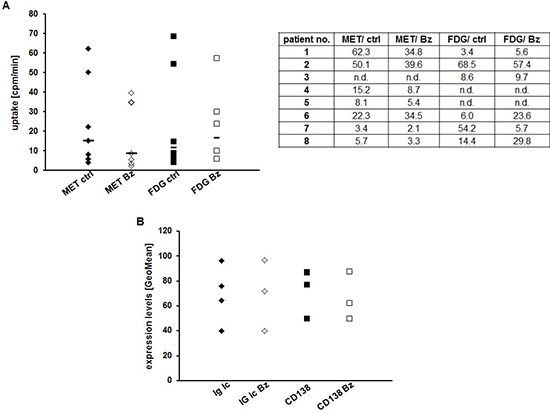
Figure 4. Assessing early response to Bz in CD138+-plasma cells using MET or FDG.

(A) CD138+-plasma cells from individual patients were or were not treated with Bz for 24 h, subsequently incubated with either FDG or MET for 60 min and intracellular radioactivity was quantified using a gamma-counter. Relative uptake of background- and decay-corrected samples was expressed as mean cpm per 1000 cells. Horizontal lines indicate the median in each group. The table gives the uptake values (cpm/1000 cells) for each patient. (B) Cell surface expression of CD138 and intracellular levels of Ig light chains in control and treated primary MM cells are shown as GeoMean (n = 4).
